There are a lot of indicators in the forex market, and you will find a lot of MT4 indicators that will be useful for you and suitable for your strategy; you can use as many indicators as you want; however, if you use too many indicators in the chart it will be messy, so try to choose the right MT4 indicators for your strategy, and the MT4 indicators signals are not enough to decide like enter/close a trade because they help you to understand better what is going on in the market with your strategy that means your strategy is Number 1.
Easy guide to how to use MetaTrader 4
Why using MT4 indicators?
Since MT4 is a popular platform among traders, it also has many indicators that are very useful for making better trading decisions. Sometimes, indicators tell us what we don’t see in the chart.
MT4 indicators Types
There are many types of MT4 indicators, but we will mention the most 2 popular types of MT4 indicators that many traders use..
>>>Understanding the 5 Roles of Expert Advisors to Success in Forex
1 – Trend
Trend indicators help you identify the market’s trend strength, whether bullish or bearish. If it’s bullish, that means the buyers are in control right now, but that doesn’t mean you have to buy because maybe the retracement will occur, so always keep the strategy in mind.
The most popular Trend indicators are (Moving average, Bollinger Bands, Ichimoku)
Moving average
Used to smooth out price data by creating a constantly and repeatedly updated average price.
Moving average settings
The indicator setting menu appears using the following steps:
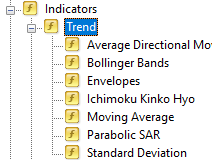
- Press CTRL+N, which will open the Navigation Tab.
- Go to Indicator>Trend> “double click” on Moving Average
- Set the desired period
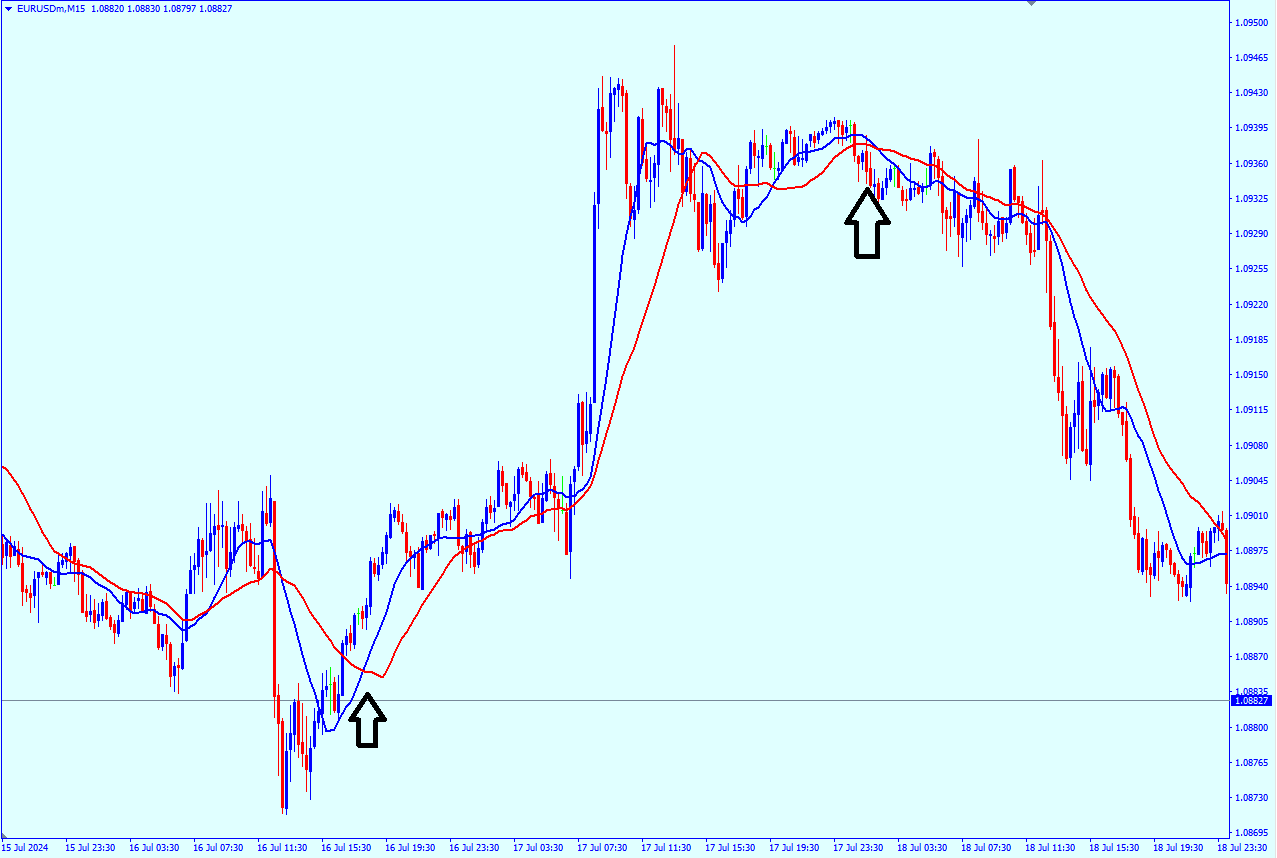
You can use more than 1 moving average (MA); there are strategies based on the cross of the 2 moving averages. For example, if you add MA 14 and 28, and if MA 14 crosses with 28 upside, that’s a buy signal.
In this example, there was a cross of 14 MA and 28 MA, which is a signal to Enter the trade. However, as you can see, there are a lot of Crosses, so you can’t enter the trade according to the Moving average Signals only.
Bollinger Bands
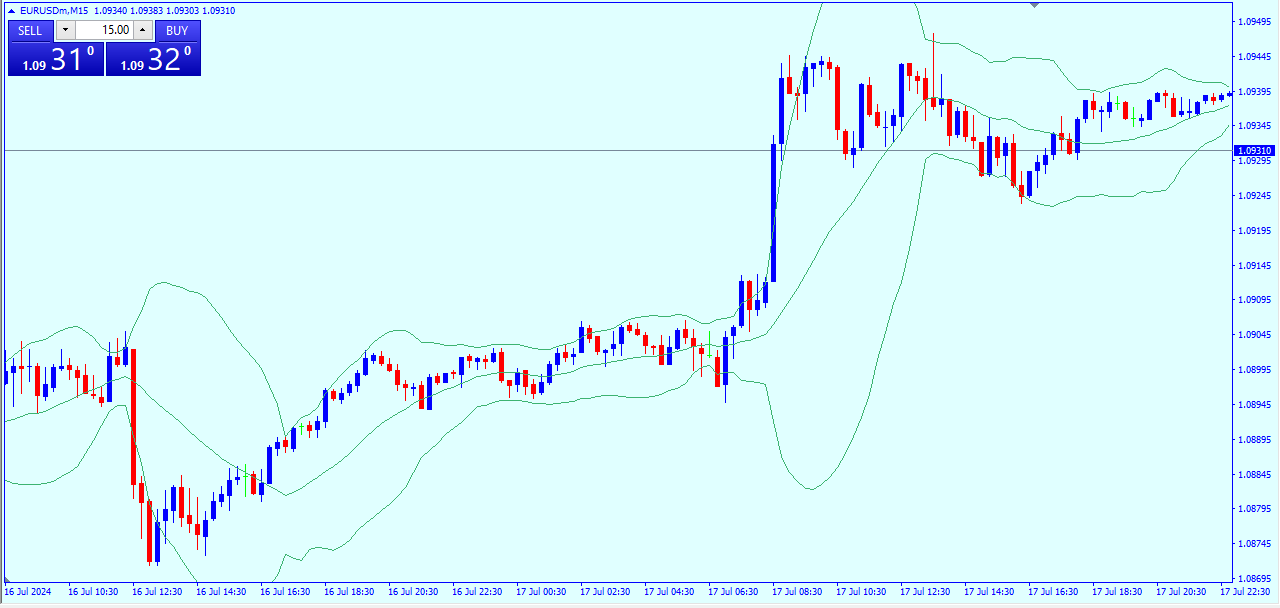
Bollinger Bands contains three lines: the bottom line is support, the middle line is Equalipream, and the top line is Resistance. Many traders use Bollinger Bands for Entry when the Bollinger tights mean an expansion will come soon.
In this example, there were Sideways moves, and the Bollinger bands were tight; that means the expansion will occur, but you can’t know if the expansion will be Upside or Downside, your strategy and Analysis technique will help you to find out the direction of the expansion.
Bollinger bands
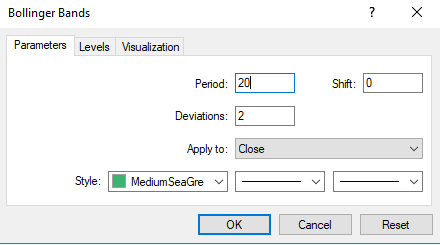
Bollinger bands settings
The popular settings are the default, but you can also change the settings as you want. But its not necessary if the current settings are suitable for you
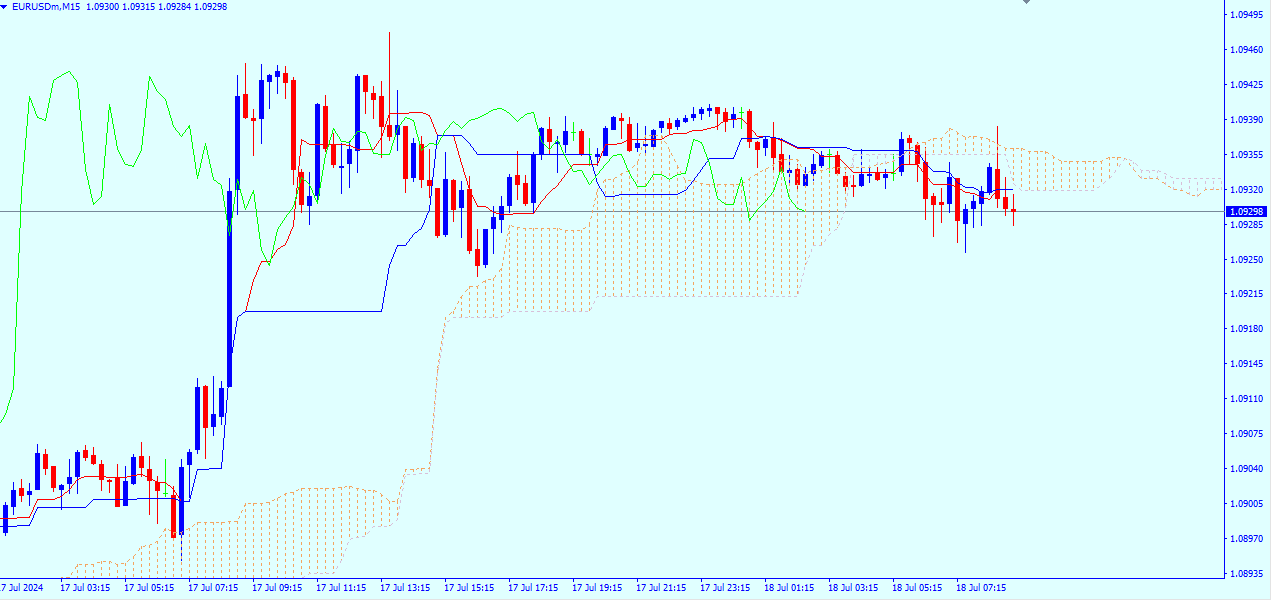
Ichimoku kinko hyo
For the first look at the Ichimoku, you will see that it is a very difficult and complicated indicator, but once you understand it, it will be easy to use. Ichimoku contains 3 indicators in 1, and it’s about clouds. These clouds act as support and resistance levels
2 – Oscillators
This type of mt4 indicators shows the Oversold of sellers and Overbought of buyers; you can use this type as a confirmation signal if the price reaches your Point of interest, and you can take action with it; the most popular indicators in oscillators are (MACD, Relative Strength Index (RSI), Stochastic)
MACD
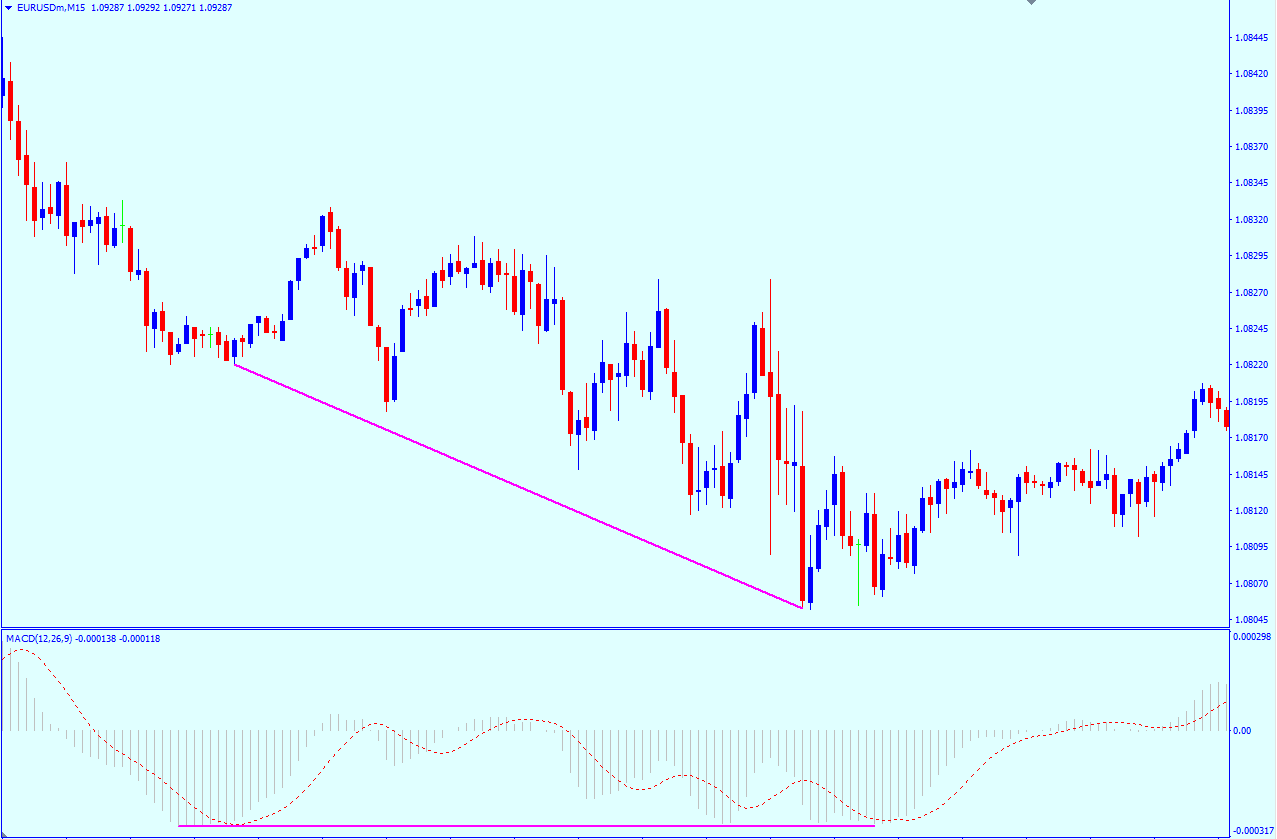
You can use MACD signals as a confirmation signal beside the POI of your strategy or as an Entry signal because many traders use MACD to determine the Divergence Between MACD and the Candlestick chart
For example, if EURUSD made a Lower Low and MACD failed to make a lower low too, that means it is a signal that the low will be strong and will push the price higher; of course, you may add some additional indicators with it, or it can help you with your strategy, but I don’t recommend to use only MACD as a signal to enter the trade.
RSI
RSI is a very strong indicator, and it’s very popular among traders, it’s a little bit similar to MACD, but it’s more accurate.
There are 2 levels in RSI (30 and 70), and you can add a 50% level if you want to know where is the equilibrium level.
How to upload mt4 indicators
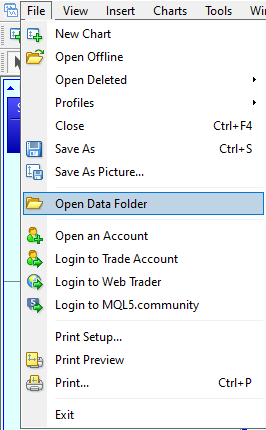
First, go to MT4 –> open File (in the top left) –> choose open data folder
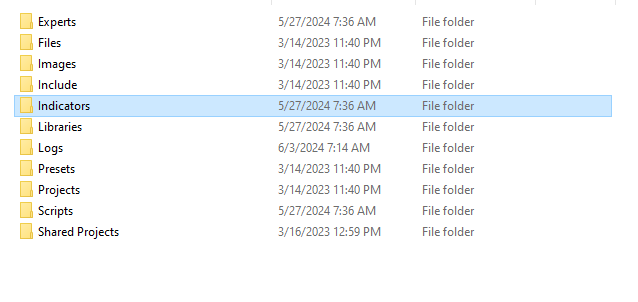
The Data folder of the MT4 will open choose MQL4 –> indicators
Download MT4 for Android & IOS

