


Fibonacci Progression With Breaks MT5 (Original version)

Subscriptions for Special Plan
- 30 EA package is more economical!
- Special package with 99%
- Download 1 EA/Day
Subscriptions for Premium Membership
- Download Unlimited in 1 Year
- Get 100% Discount
- Get free access to all

Subscriptions for Gold Membership
- 1 Year Membership
- Get 100% Discount
- Access EA+Indicator+Course
Frequently bought together 🎁
Add these products to enhance your purchase


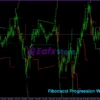
Fibonacci Progression With Breaks MT5: Volatility-Adaptive Price Action Indicator
The Fibonacci Progression With Breaks MT5 is a powerful technical indicator designed to identify significant deviations in price action from a central reference level. Leveraging the Fibonacci sequence and Average True Range (ATR), this indicator plots progressive breakout levels and highlights high-probability buy/sell opportunities based on volatility-based thresholds. It’s an indispensable tool for traders focusing on mean reversion, breakout confirmation, and volatility expansion strategies.
Key Features
🔹Volatility-Adaptive Deviation Zones: Identifies significant price deviations from a central baseline, calculated using the Average True Range (ATR) of period 200 and scaled by a user-defined multiplier.
🔹Fibonacci Progression Levels: Utilizes the Fibonacci sequence to plot progressive breakout levels above and below the central line, projecting potential targets.
🔹Clear Break Confirmation Signals: Marks signals as Buy, Sell, Target Hit, or Stop Hit when the price decisively breaks a level beyond the expected deviation threshold.
🔹Visual Buy/Sell Indicators: Clearly indicates ideal entry points for long positions with Green arrows/lines and ideal entry points for short positions with Red arrows/lines.
🔹Multi-Level Targets & Stop Zones: Provides visual cues for primary Take-profit (TP) levels (Green) and primary Stop-loss (SL) zones (Red).
Additional Features
🔹Customizable ATR Multiplier: Allows traders to adjust the multiplier applied to the ATR value to scale the deviation zone according to their preferred sensitivity.
🔹Adjustable Fibonacci Sequence Length: Users can define the “Sequence Length” to control the number of Fibonacci levels plotted, offering flexibility in target projections.
🔹Comprehensive Color Settings: Extensive color customization for labels, target lines, stop lines, buy/sell signals, and hit/miss markers for instant visual interpretation.
🔹Average Position Visuals: Displays “Average Buy” and “Average Sell” lines, providing visual aids for tracking average open positions.
🔹Support & Resistance Zones: Red Lines represent upper breakout/resistance zones, while Green Lines represent lower breakout/support zones.
🔹Entry/SL/TP Visualization: Small Horizontal Lines indicate likely entry levels, SL/TP zones, or dynamic levels.
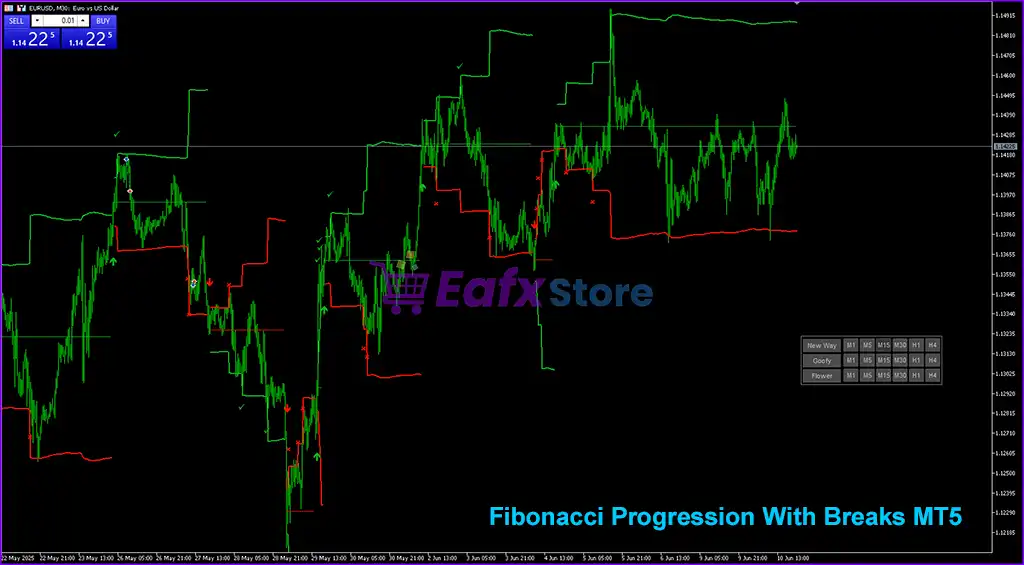
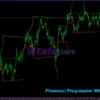
Fibonacci Progression With Breaks MT5 Review
Traders can easily adjust key parameters like “Size” and “Sequence Length” to align the indicator with specific strategies and trading styles. Applicable for various strategies, including scalping breakout zones in high volatility, trend-following with progressive target setting, identifying false breakouts, and layered take-profit strategies.
Fibonacci Progression With Breaks MT5 Setting
Fibonacci Progression With Breaks MT5 Reviews
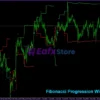
Fibonacci Progression With Breaks MT5 Review
Fibonacci Progression With Breaks MT5 Overview
Why choose and use Fibonacci Progression With Breaks?
🔹Volatility-Responsive: Dynamically adjusts to market conditions by leveraging ATR, making it highly adaptable to varying volatility.
🔹Mathematically Integrated: Naturally integrates Fibonacci sequences, reflecting common price behavior patterns for more insightful analysis.
🔹Multi-Level Targets: Aids in setting layered take-profits or scaling-in strategies, optimizing profit capture.
🔹Clear & Beginner-Friendly Visual Cues: With intuitive color-coded zones, arrows, and status lines, interpretation is straightforward, even for novice traders.
🔹Highly Customizable: Traders can easily adjust key parameters like “Size” and “Sequence Length” to align the indicator with specific strategies and trading styles.
🔹Versatile Use Cases: Applicable for various strategies, including scalping breakout zones in high volatility, trend-following with progressive target setting, identifying false breakouts, and layered take-profit strategies.
🔹Optimizes Risk-Reward Ratios: Provides insightful signals that help traders optimize their risk-reward ratios while capturing high-probability price movements.
🔹Reliable for Breakout Trading: Provides clear setups for both Buy (price closing above resistance with confirmation) and Sell (price closing below support with confirmation) breakouts.
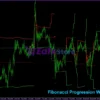
How to Use This Indicator
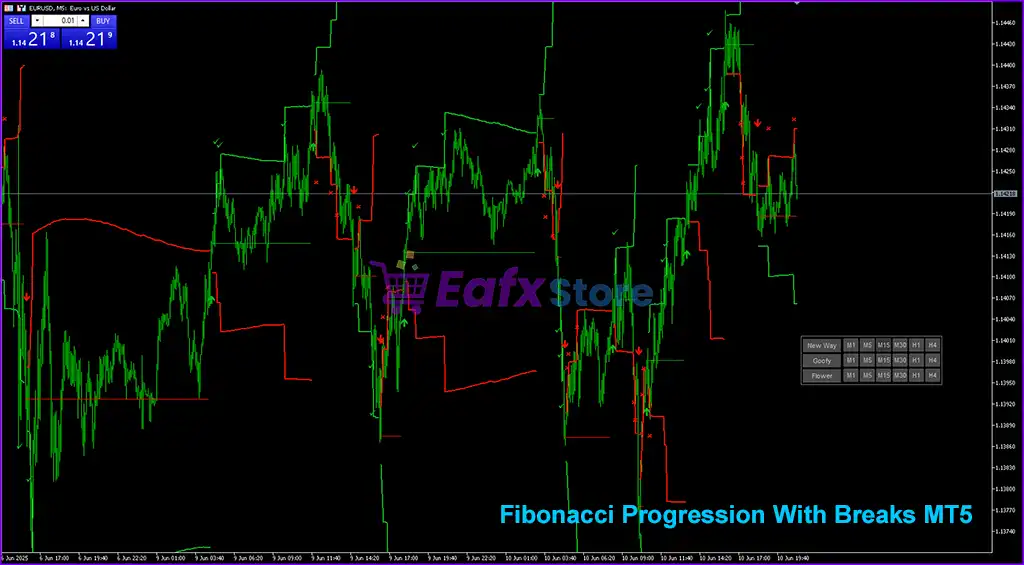
1. Indicator Components:
🔹Red Lines (Upper Box Levels): Resistance zones or upper breakout levels.
🔹Green Lines (Lower Box Levels): Support zones or lower breakout levels.
🔹Red Arrows ⬇️: Sell signal — price likely broke below the support or failed to break above resistance.
🔹Green Check Marks ✅: Possible confirmation of successful trade direction.
🔹Red “X” Marks ❌: Failed breakout or invalid signal marker.
🔹Small Horizontal Lines: Likely entry levels, SL/TP zones, or dynamic levels.
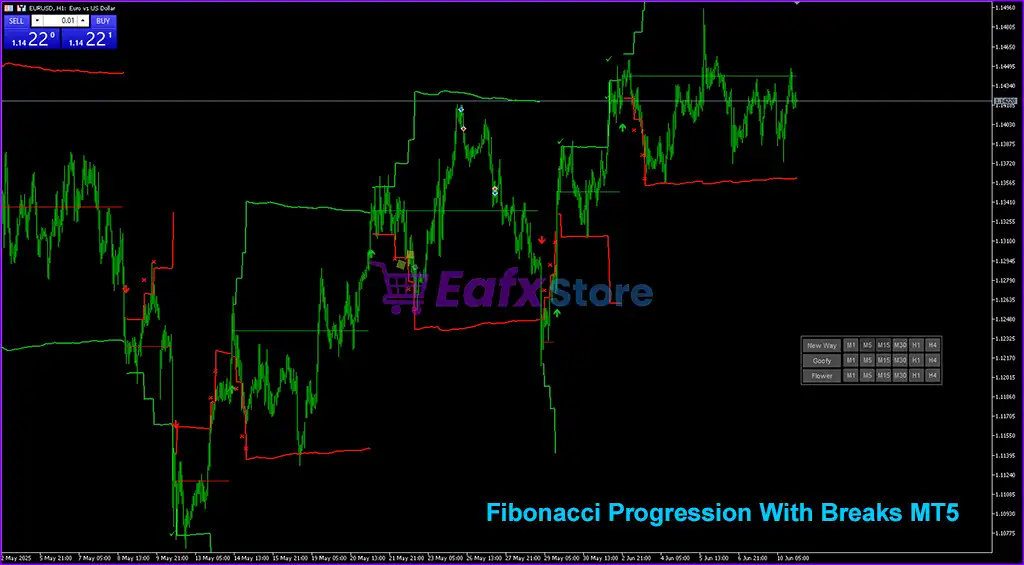
2. Breakout Trading Strategy:
2.1. Buy Setup (Breakout Up):
🔹When price closes above the red resistance line.
🔹Confirm with green ✅ check mark.
🔹Stop Loss: Below the breakout level or lower green line.
🔹Take Profit: Based on risk-reward ratio or next resistance zone.
2.2. Sell Setup (Breakout Down):
🔹When price closes below the green support line.
🔹Confirm with red ⬇️ arrow and/or ❌ at retest.
🔹Stop Loss: Above the breakout level or recent swing high.
🔹Take Profit: Use previous low or channel width.
Trading Specifications
Recommended settings and parameters to pay attention to from developers and experts:
| Features | Type |
|---|---|
| Trading platform | MetaTrader 5 (MT5) |
| Time frames | Any |
| Currency pairs | Any |
| Minimum / Recommended deposit | Any |
| Minimum / Recommended leverage | Any |
| Product type | NoDLL / Fix |
| Additional services | Unlock and Decompile |
| Recommended brokers | Exness Broker, Icmarkets Broker |
| Recommended VPS | MyfxVPS.com (Blue VPS, Golden VPS). Lowest Latency, 2 week Free Trial, 100% Free for 12-18 Months. |
Product Download Package?
The download package of the product suite includes:
✅ Indicators: Fibonacci Progression With Breaks (LuxAlgo).ex5
Conclusion: Unlock Precision Trading with Fibonacci Progression With Breaks MT5
In short, The Fibonacci Progression With Breaks indicator is a cutting-edge, volatility-sensitive tool that equips traders with actionable insights for breakout, trend-following, and mean reversion strategies. By combining Fibonacci sequence levels with ATR-based deviation zones, this MT5 indicator adapts to dynamic market conditions and pinpoints high-probability buy/sell opportunities with visual clarity and precision.
Whether you’re scalping volatile markets or building multi-level take-profit strategies, this indicator empowers you with real-time entry, stop-loss, and target guidance. Highly customizable, beginner-friendly, and mathematically grounded, Fibonacci Progression With Breaks is the ideal choice for traders seeking a reliable edge in unpredictable markets.
User Reviews
Only logged in customers who have purchased this product may leave a review.
1. What is the main purpose of the Fibonacci Progression With Breaks MT5 indicator?
This indicator is designed to identify key breakout levels and mean reversion opportunities by using Fibonacci progression and ATR-based deviation zones, helping traders anticipate high-probability buy/sell setups.
2. How does the indicator determine breakout or reversion zones?
It calculates a central baseline and uses the Average True Range (ATR) scaled by a multiplier to create dynamic deviation zones. Fibonacci levels are then plotted above and below this baseline to project breakout targets.
3. Is it suitable for all trading styles?
Yes. The indicator is versatile and customizable, making it ideal for scalping, intraday trading, trend-following, and volatility breakout strategies.
4. What timeframes and symbols does it support?
It works on any timeframe and with any currency pair or trading instrument, offering broad flexibility across markets and strategies.
5. How does the indicator signal entry and exit points?
It uses green arrows/lines to suggest ideal long entries, and red arrows/lines for short entries. It also marks target hit and stop hit levels visually for easy interpretation.
6. Can I adjust the sensitivity of breakout zones?
Yes. You can modify the ATR multiplier to change the size of the deviation zone, making it more or less sensitive depending on your risk appetite and market volatility.
7. What is the “Sequence Length” setting used for?
“Sequence Length” allows you to control the number of Fibonacci progression levels plotted. This helps define how many breakout targets or support/resistance zones are displayed.
8. Does the indicator provide stop-loss and take-profit guidance?
Yes. It visually plots primary take-profit (TP) and stop-loss (SL) zones, helping traders define their risk-reward ratio and exit levels clearly.
9. Is this indicator beginner-friendly?
Absolutely. It offers intuitive color-coded visuals, such as arrows and breakout levels, making it easy for new traders to understand market signals without relying on complex analysis.
10. Can I use this tool on MetaTrader 4 (MT4)?
No. This version is specifically designed for MetaTrader 5 (MT5). For MT4 compatibility, a separate version (if available) would need to be used.
🔥 Get This EA for FREE with Our Membership! 🚀🚀
Unlock access to this EA, premium Indicators, and exclusive trading tools completely FREE with any of our Membership Plans! Thousands of traders already benefit from our VIP library—join them and level up your trading instantly. Choose Your Membership:
- SPECIAL – 1 Month Membership
- GOLD – 1 Year Membership
- PREMIUM – 1 Year Membership
-
 – GroupBuy 7") Original price was: $199.00.$75.00Current price is: $75.00.
Original price was: $199.00.$75.00Current price is: $75.00. -
 – GroupBuy 8") Original price was: $199.00.$75.00Current price is: $75.00.
Original price was: $199.00.$75.00Current price is: $75.00. -
 – GroupBuy 9") Original price was: $199.00.$75.00Current price is: $75.00.
Original price was: $199.00.$75.00Current price is: $75.00. -
 – GroupBuy 10") Original price was: $199.00.$75.00Current price is: $75.00.
Original price was: $199.00.$75.00Current price is: $75.00.
-
 13") 1Original price was: $570.00.$59.00Current price is: $59.00.
1Original price was: $570.00.$59.00Current price is: $59.00. -
 14") 1Original price was: $299.00.$59.00Current price is: $59.00.
1Original price was: $299.00.$59.00Current price is: $59.00. -
 15") 1Original price was: $99.00.$59.00Current price is: $59.00.
1Original price was: $99.00.$59.00Current price is: $59.00. -
 16") 0Original price was: $98.00.$69.00Current price is: $69.00.
0Original price was: $98.00.$69.00Current price is: $69.00.
There are no reviews yet.