


SMT Divergence ICT Indicator MT4 (Platform build 1453+)

Subscriptions for Special Plan
- 30 EA package is more economical!
- Special package with 99%
- Download 1 EA/Day
Subscriptions for Premium Membership
- Download Unlimited in 1 Year
- Get 100% Discount
- Get free access to all

Subscriptions for Gold Membership
- 1 Year Membership
- Get 100% Discount
- Access EA+Indicator+Course
Frequently bought together 🎁
Add these products to enhance your purchase


SMT Divergence (ICT) Indicator: Advanced Intermarket Divergence for Smart Money Concepts
The SMT Divergence (ICT) Indicator is a sophisticated custom tool specifically built for professional traders following Inner Circle Trader (ICT) or Smart Money Concept (SMC) methodologies. It excels at identifying intermarket divergences by comparing price action across user-defined correlated or inversely correlated currency pairs. This allows for the detection of Smart Money Trap (SMT) divergence setups, which often precede high-probability reversals, institutional liquidity grabs, and offer early signals of potential market manipulation.
Key Features
🔹Intermarket Divergence Identification (ICT Style): Specifically designed to detect divergences between directly correlated (e.g., GBPUSD, EURCAD) and inversely correlated currency pairs, a hallmark of ICT concepts.
🔹Smart Money Trap Setup Detection: Focuses on identifying SMT divergences, which are crucial for anticipating high-probability reversals and areas where institutional players are likely to enter or exit the market.
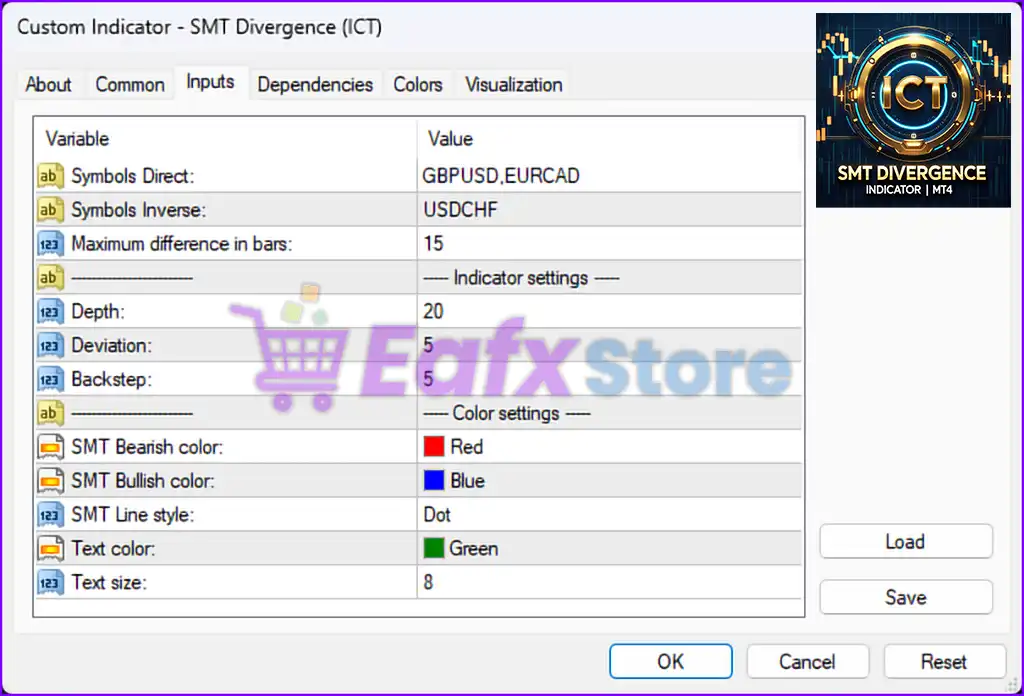
🔹Advanced Filtering Algorithms: Uses Depth (number of bars for highs/lows), Deviation (price threshold), and Backstep (bars between pivots) to filter out false signals and accurately compare relative strength between correlated pairs.
🔹Visual Divergence Highlighting: Clearly highlights both SMT Bearish (Red) and SMT Bullish (Blue) divergences directly on the chart, connecting them with dotted lines for easy identification.
Additional Features
🔹Configurable Correlated Pairs: Allows users to explicitly define both Symbols Direct (e.g., GBPUSD, EURCAD) and Symbols Inverse (e.g., USDCHF) for tailored intermarket analysis.
🔹Maximum Bar Difference Control: Maximum Difference in Bars parameter allows for a maximum bar shift between divergences, aiding in syncing timeframes and detecting subtle shifts.
🔹Color & Text Customization: Provides full control over SMT Bearish Color, SMT Bullish Color, SMT Line Style, Text Color, and Text Size for chart readability and personalized aesthetics.
🔹Minimal Chart Clutter: Designed to provide institutional-grade precision without overwhelming the chart with unnecessary indicators.
🔹Compatibility with Price Action & Liquidity Concepts: Integrates seamlessly with strategies involving market structure shifts, liquidity sweeps, Fair Value Gaps (FVG), and risk-based Stop Loss/Take Profit placement.
SMT Divergence ICT Indicator Review
Important Notes When Using SMT Divergence ICT Indicator:
✅ Accuracy and Latency: SMT Divergence is an advanced concept and can sometimes be difficult to spot. This indicator helps automate the process, but there may still be delays or imperfect signals.
✅ Not a Stand-alone Signal: SMT Divergence should be used as a confirmation signal, not as a sole entry signal. You need to combine it with other analysis such as:
🔹Market Structure: Is price at an important support/resistance level? Is there a market structure break?
🔹Liquidity: Is price clearing liquidity at a specific level?
🔹Volume: Does the trading volume confirm the divergence?
🔹Candlestick Patterns: Are there any reversal candlestick patterns appearing at the point of divergence?
✅ Risk Management: Always set Stop Loss and Take Profit appropriately.
SMT Divergence ICT Indicator Reviews
SMT Divergence ICT Indicator Review
How to Use This Indicator?
1. Identify Major and Correlated Currency Pairs:
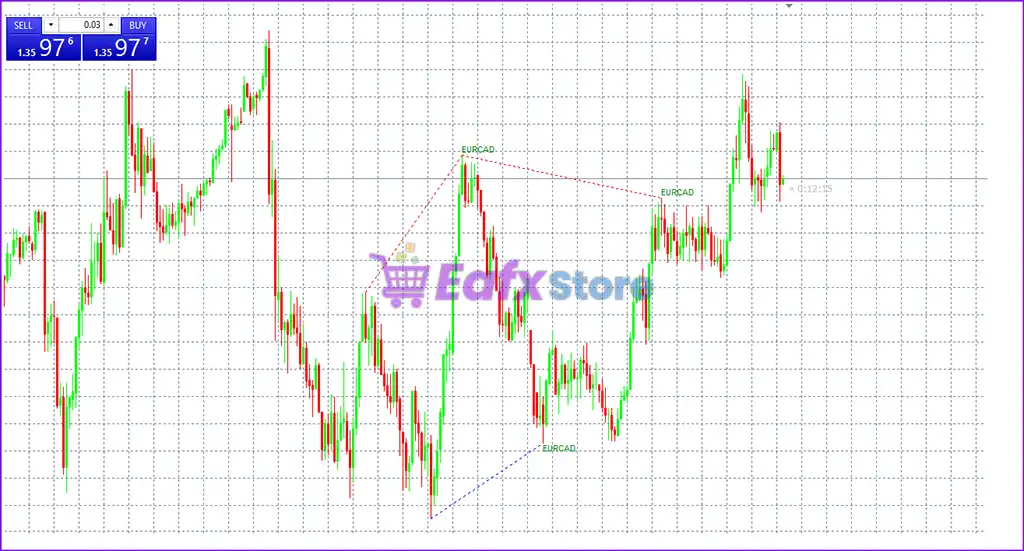
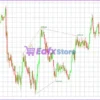
🔹In this example, you are looking at the chart of the EURCAD pair.
🔹The indicator will automatically compare EURCAD with one or more other currency pairs that are strongly correlated with it (e.g. EURUSD, CADCHF, etc. – although the image only shows “EURCAD” in the markers).
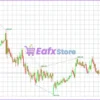
2. Identify Divergence:
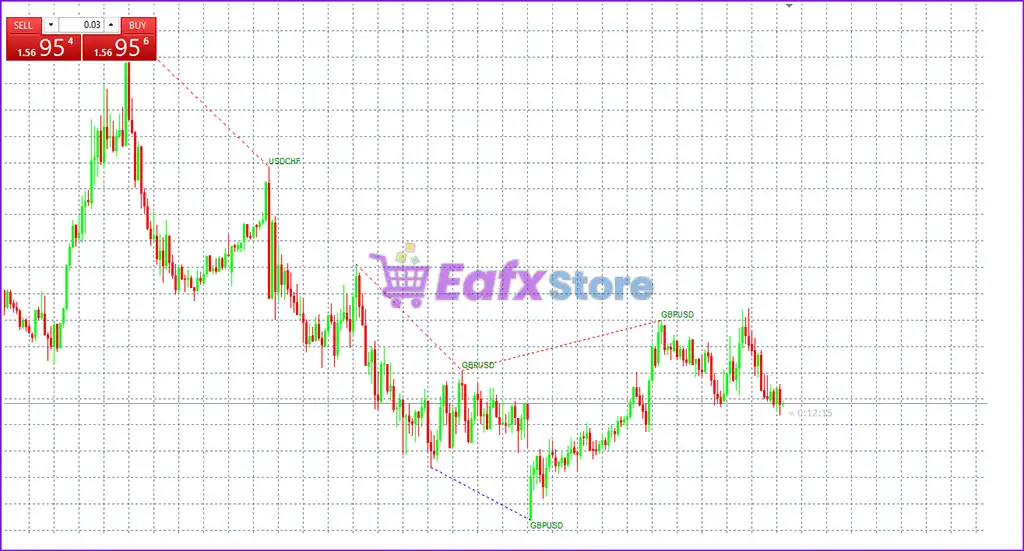
🔹The indicator will draw dotted lines (red and blue) connecting the peaks or troughs on the price chart of the current currency pair (EURCAD) with the corresponding peaks/troughs of the correlated currency pair (although the correlated pair is not visible on this chart, the indicator is making the comparison implicitly).
🔹Bullish Divergence (blue line): Occurs when the price of the major currency pair makes a lower low, but the price of the correlated currency pair makes a higher or equal low. This is a potential buy signal, indicating a weakening of the downtrend and a possible reversal to the upside. In the image, you can see a blue dotted line connecting the two lows of EURCAD, indicating a possible bullish divergence.
🔹Bearish Divergence (red line): Occurs when the price of the major currency pair makes a higher high, but the price of the correlated currency pair makes a lower or equal high. This is a potential sell signal, indicating a weakening of the uptrend and a possible reversal to the downside. In the image, you can see red dotted lines connecting the two highs of EURCAD, indicating a possible bearish divergence.
3. Entering orders based on divergence signals:
🔹When the indicator draws a green dotted line connecting the bottoms, indicating bullish SMT divergence, you can consider opening a buy order.
🔹When the indicator draws a red dotted line connecting the tops, indicating bearish SMT divergence, you can consider opening a sell order.
Trading Specifications
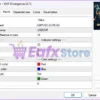
Recommended settings and parameters to pay attention to from developers and experts:
| Features | Type |
|---|---|
| Trading platform | MetaTrader 4 (MT4) |
| Time frames | Any |
| Currency pairs | GBPUSD, EURCAD, USDCHF |
| Minimum / Recommended deposit | Any |
| Minimum / Recommended leverage | Any |
| Product type | NoDLL / Fix |
| Additional services | Unlock and Decompile |
| Recommended brokers | Exness Broker, Icmarkets Broker |
| Recommended VPS | MyfxVPS.com (Blue VPS, Golden VPS). Lowest Latency, 2 week Free Trial, 100% Free for 12-18 Months. |
Product Download Package?
The download package of the product suite includes:
✅ Candle_Timer.ex4
✅ SMT Divergence (ICT).ex4
Conclusion – Unlock Institutional Precision with the SMT Divergence (ICT) Indicator
In short, The SMT Divergence (ICT) Indicator is a cutting-edge tool engineered for traders applying ICT and Smart Money Concepts to their strategies. By automating the detection of intermarket divergences between correlated and inversely correlated currency pairs, this indicator gives users an advanced edge in spotting potential reversals, liquidity grabs, and manipulative market behavior. With visual SMT divergence signals, customizable settings, and seamless integration with price action and liquidity-based trading systems, it empowers traders to align their entries with institutional footprints.
User Reviews
Only logged in customers who have purchased this product may leave a review.
❓1. What is the SMT Divergence (ICT) Indicator?
The SMT Divergence (ICT) Indicator is a custom tool for MetaTrader 4 designed to detect intermarket divergences between correlated or inversely correlated currency pairs, based on Smart Money Concepts (SMC) and ICT strategies. It highlights potential institutional traps and high-probability reversal zones using visual cues on the chart.
❓2. How does this indicator help with Smart Money Concepts (SMC) trading?
The indicator detects Smart Money Trap (SMT) divergences, a key component in SMC/ICT methodology. These divergences reveal potential manipulation by institutional players and can be used to confirm trade entries at liquidity sweep zones or during market structure shifts.
❓3. Does the SMT Divergence (ICT) Indicator repaint or lag?
No. The SMT Divergence Indicator does not repaint signals. It uses predefined conditions like depth, deviation, and backstep to filter and confirm divergence setups, ensuring signals remain on the chart once printed.
❓4. Can I customize the correlated currency pairs used in the divergence calculation?
Yes. You can define both directly correlated (e.g., EURCAD, GBPUSD) and inversely correlated pairs (e.g., USDCHF) through the indicator’s settings, allowing for flexible intermarket analysis based on your trading style.
❓5. What do the red and blue dotted lines mean?
Red dotted lines indicate SMT Bearish Divergence—a potential reversal from an uptrend.
Blue dotted lines indicate SMT Bullish Divergence—a possible reversal from a downtrend.
These visual cues connect divergence points across timeframes and correlated pairs.
❓6. Is the SMT Divergence indicator suitable for all timeframes?
Yes. The indicator works on any timeframe, from M1 to D1, making it ideal for both intraday scalping and long-term swing trading when combined with proper market structure and liquidity analysis.
❓7. Can I use this indicator as a standalone trading system?
No. SMT Divergence is not meant to be a standalone entry tool. It should be used as confirmation in conjunction with:
✅ Market structure breaks.
✅ Liquidity sweeps.
✅ Candlestick reversal patterns.
✅ Volume analysis.
❓8. What are the recommended currency pairs for this indicator?
While the indicator supports any pairs, it is especially effective with GBPUSD, EURCAD, and USDCHF due to their strong correlations and common usage in ICT/SMC strategies.
🔥 Get This EA for FREE with Our Membership! 🚀🚀
Unlock access to this EA, premium Indicators, and exclusive trading tools completely FREE with any of our Membership Plans! Thousands of traders already benefit from our VIP library—join them and level up your trading instantly. Choose Your Membership:
- SPECIAL – 1 Month Membership
- GOLD – 1 Year Membership
- PREMIUM – 1 Year Membership
-
 – GroupBuy 5") Original price was: $340.00.$90.00Current price is: $90.00.
Original price was: $340.00.$90.00Current price is: $90.00. -
 – GroupBuy 6") Original price was: $250.00.$70.00Current price is: $70.00.
Original price was: $250.00.$70.00Current price is: $70.00. -
 – GroupBuy 7") Original price was: $300.00.$80.00Current price is: $80.00.
Original price was: $300.00.$80.00Current price is: $80.00. -
 – Group Buy 8") Original price was: $499.00.$120.00Current price is: $120.00.
Original price was: $499.00.$120.00Current price is: $120.00.
-
 11") 1Original price was: $299.00.$59.00Current price is: $59.00.
1Original price was: $299.00.$59.00Current price is: $59.00. -
 12") 0Original price was: $199.00.$69.00Current price is: $69.00.
0Original price was: $199.00.$69.00Current price is: $69.00. -
 13") 0Original price was: $199.00.$69.00Current price is: $69.00.
0Original price was: $199.00.$69.00Current price is: $69.00. -
 0Original price was: $399.00.$59.00Current price is: $59.00.
There are no reviews yet.