
The Keltner Channel indicator is widely used in Forex, stocks, commodities, indices and cryptocurrency markets.
By combining an Exponential Moving Average (EMA) with the Average True Range (ATR), Keltner Channels create dynamic bands around price. These bands can help traders understand whether the market is trending, ranging, expanding, or experiencing a potential breakout.
In this guide, you will learn what Keltner Channels are, how the Keltner Channel indicator works, the best Keltner Channel settings, popular Keltner Channel trading strategies, and the difference between Keltner Channels and Bollinger Bands.
What are Keltner Channels?
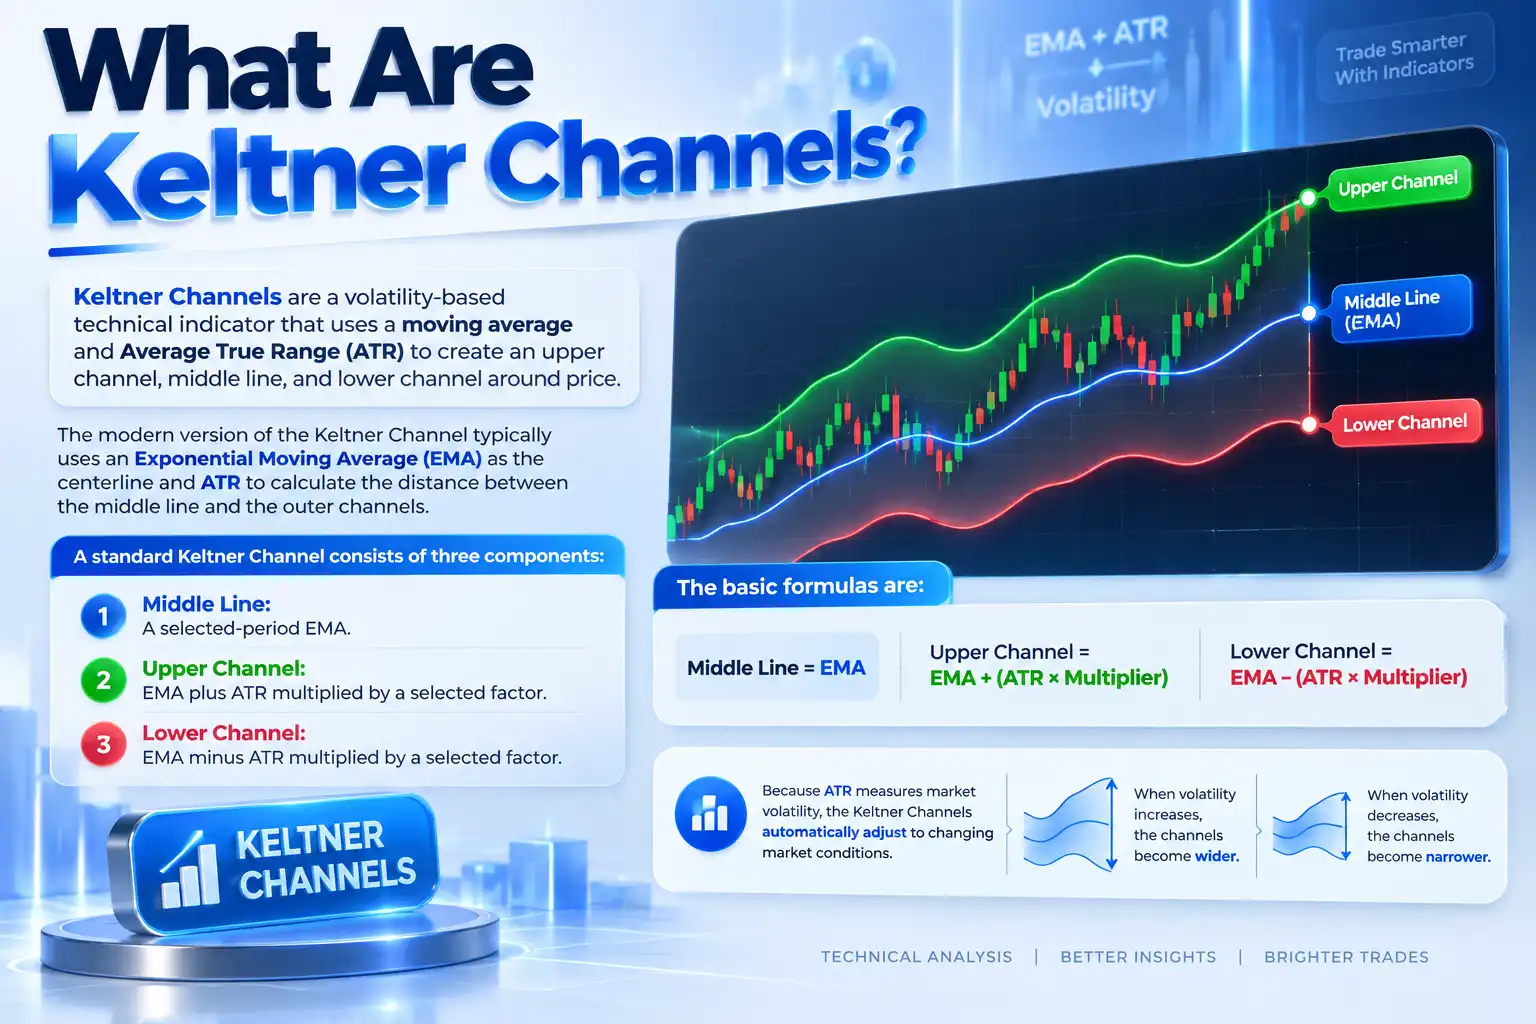
Keltner Channels are a volatility-based technical indicator that uses a moving average and Average True Range (ATR) to create an upper channel, middle line, and lower channel around price.
The modern version of the Keltner Channel typically uses an Exponential Moving Average (EMA) as the centerline and ATR to calculate the distance between the middle line and the outer channels.
A standard Keltner Channel consists of three components:
- Middle Line: A selected-period EMA.
- Upper Channel: EMA plus ATR multiplied by a selected factor.
- Lower Channel: EMA minus ATR multiplied by a selected factor.
The basic formulas are:
Middle Line = EMA
Upper Channel = EMA + (ATR × Multiplier)
Lower Channel = EMA − (ATR × Multiplier)
Because ATR measures market volatility, the Keltner Channels automatically adjust to changing market conditions.
When volatility increases, the channels become wider. When volatility decreases, the channels become narrower.
How Does the Keltner Channel Indicator Work?
The Keltner Channel trading indicator helps traders analyze the relationship between price, trend direction, and volatility.
When price trades above the middle EMA and the channel slopes upward, it can indicate a bullish environment. When price remains below the middle EMA and the channel slopes downward, it can suggest bearish conditions.
The outer channels can also provide information about price strength.
A sustained move near the upper channel may indicate strong bullish momentum, while continued trading near the lower channel can suggest strong bearish pressure.
However, traders should not automatically sell when price reaches the upper channel or buy when price reaches the lower channel. In a strong trend, price can remain close to an outer band for a long time.
Therefore, Keltner Channels should be used as a market-analysis framework rather than a standalone buy or sell signal.
What are the Best Keltner Channel Settings?
One of the most common questions traders ask is: What are the best Keltner Channel settings?
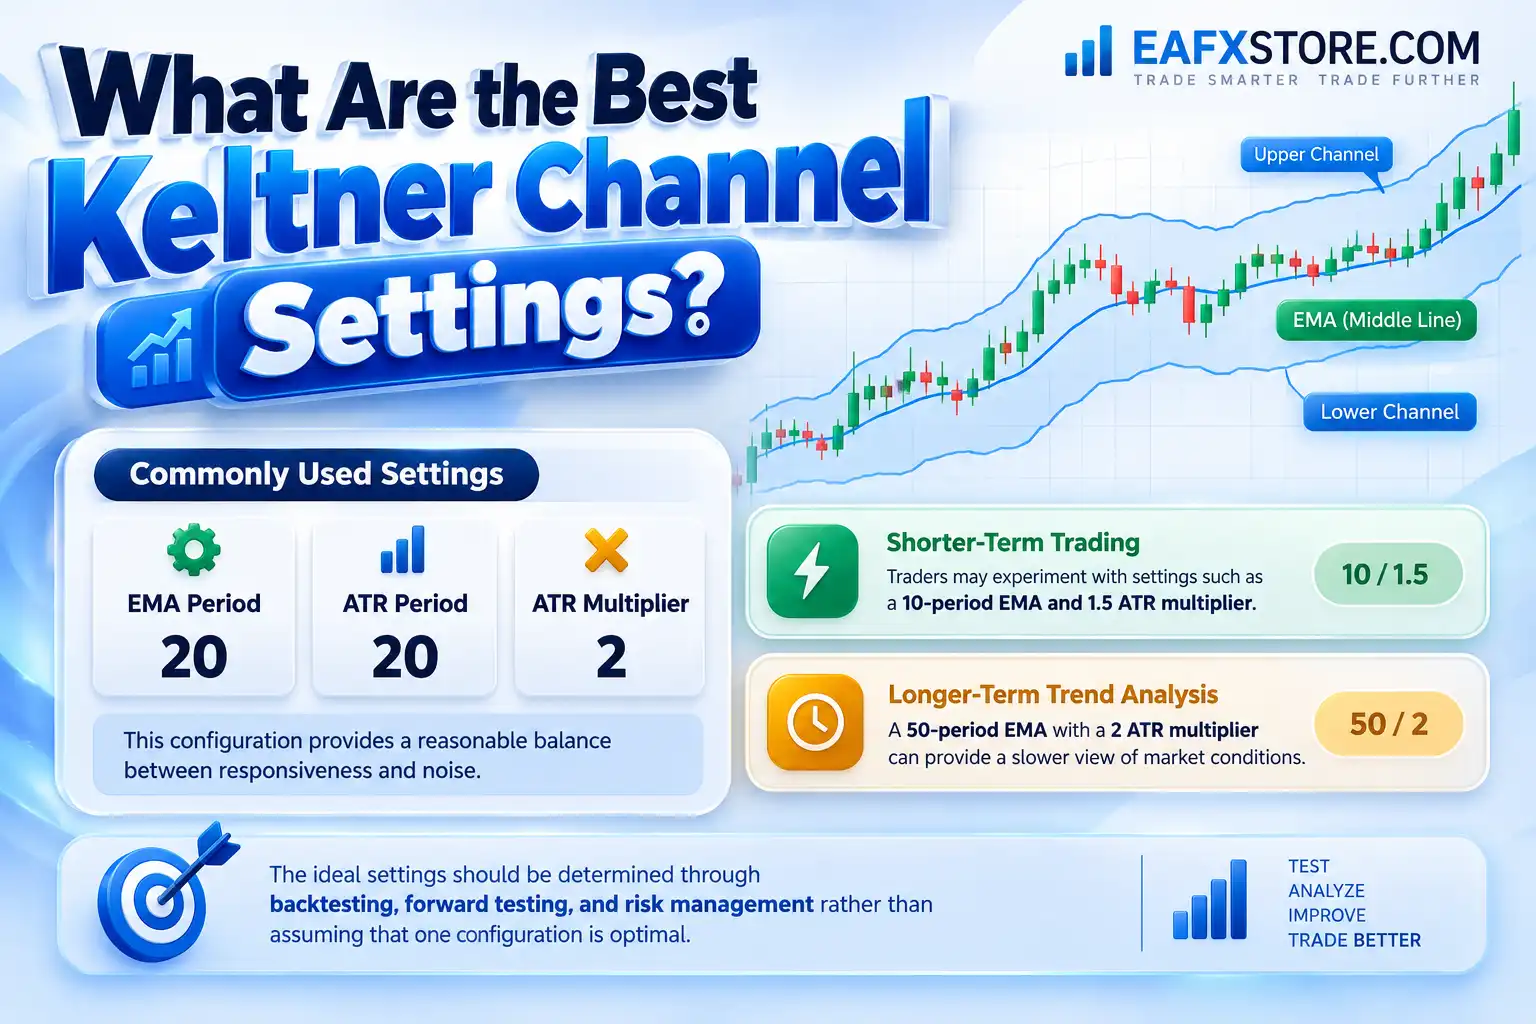
There is no universal setting that works for every market, asset, and timeframe. However, a commonly used configuration is:
- EMA Period: 20
- ATR Period: 20
- ATR Multiplier: 2
This configuration provides a reasonable balance between responsiveness and noise.
For shorter-term trading, traders may experiment with settings such as a 10-period EMA and 1.5 ATR multiplier. For longer-term trend analysis, a 50-period EMA with a 2 ATR multiplier can provide a slower view of market conditions.
The ideal settings should be determined through backtesting, forward testing, and risk management rather than assuming that one configuration is optimal.
Keltner Channels Trading Strategy
There are several ways to build a Keltner Channel trading strategy.
1. Keltner Channel Trend-Following Strategy
The trend-following approach uses the middle EMA to identify the dominant market direction.
A potential bullish setup occurs when:
- Price is above the middle Keltner Channel line.
- The channel is trending upward.
- Price pulls back toward the middle EMA.
- Bullish price action confirms the continuation.
- The trader enters with a predefined stop-loss.
A potential bearish setup occurs when:
- Price is below the middle EMA.
- The channel is trending downward.
- Price retraces toward the middle line.
- Bearish price action confirms the setup.
- The trader enters a short position with controlled risk.
This approach attempts to buy pullbacks during uptrends and sell rallies during downtrends.
2. Keltner Channel Breakout Strategy
A breakout strategy focuses on strong price movements outside the Keltner Channel.
A break above the upper channel can signal increasing bullish momentum, while a break below the lower channel can indicate increasing bearish pressure.
However, not every breakout develops into a sustainable trend. Traders can improve confirmation by combining the Keltner Channel with:
- Support and resistance
- Market structure
- Trading volume
- Candlestick patterns
- Momentum indicators
- Higher-timeframe trends
Waiting for confirmation can help reduce false breakout signals.
3. Keltner Channel Mean Reversion Strategy
Keltner Channels can also be used in ranging markets.
When the market is moving sideways, price may repeatedly travel between the upper and lower channels. Traders can look for rejection patterns near an outer channel and a potential move back toward the middle EMA.
This strategy is most appropriate when the market lacks a strong directional trend.
Using mean reversion against a powerful trend can produce multiple losing trades, so identifying the market regime is essential.
Keltner Channels vs. Bollinger Bands
Keltner Channels vs. Bollinger Bands is a common comparison among technical traders.
Both indicators create upper and lower bands around price, but they calculate volatility differently.
Keltner Channels generally use ATR, while Bollinger Bands use standard deviation.
As a result, Keltner Channels often produce smoother volatility bands, while Bollinger Bands can react more dramatically to large changes in price dispersion.
| Feature | Keltner Channels | Bollinger Bands |
|---|---|---|
| Main volatility measurement | ATR | Standard deviation |
| Centerline | Usually EMA | Usually SMA |
| Band behavior | Generally smoother | More reactive |
| Trend analysis | Strong | Strong |
| Breakout analysis | Yes | Yes |
| Mean reversion | Yes | Yes |
| Squeeze analysis | Commonly combined with Bollinger Bands | Commonly combined with Keltner Channels |
Many traders actually use both indicators together to identify periods of compressed volatility.
Keltner Channel Squeeze
The Keltner Channel squeeze is a popular concept involving the relationship between Bollinger Bands and Keltner Channels.
When Bollinger Bands move inside the Keltner Channels, it can indicate that market volatility has contracted significantly.
This condition is sometimes interpreted as a potential setup for future volatility expansion.
Once the market breaks out of the consolidation range, traders may use price direction, momentum, and market structure to determine whether the breakout is bullish or bearish.
The squeeze itself does not predict the direction of the breakout. It primarily highlights a period of reduced volatility.
How to Use Keltner Channels for Forex Trading
The Keltner Channel indicator for Forex can be applied to major, minor, and other currency pairs across different timeframes.
For example, a trader may use a higher timeframe such as H1 or H4 to identify the overall trend and then move to M15 or M30 to search for entries.
A simple multi-timeframe approach could be:
Higher timeframe: Determine the dominant trend.
Lower timeframe: Wait for a pullback toward the Keltner middle line.
Entry: Look for confirming price action in the direction of the higher-timeframe trend.
Risk management: Place a stop-loss based on market structure rather than relying exclusively on the indicator.
This approach can help traders avoid taking every signal generated by a lower timeframe.
Keltner Channels for Day Trading and Scalping
The Keltner Channel indicator for day trading can help traders visualize intraday trends and potential pullback zones.
On lower timeframes such as M5 and M15, shorter settings may make the indicator more responsive. However, faster settings can also increase market noise and false signals.
For scalping, Keltner Channels are generally more effective when combined with additional confirmation such as:
- Market structure
- Liquidity zones
- Support and resistance
- Candlestick patterns
- Higher-timeframe direction
- Volume or momentum confirmation
Traders should also account for spreads, commissions, slippage, and trading-session volatility when evaluating a scalping strategy.
Advantages of the Keltner Channel Indicator
The Keltner Channel indicator has several advantages:
- Easy to understand and visually interpret.
- Combines trend and volatility analysis.
- Useful for breakout and pullback strategies.
- Can identify potential dynamic support and resistance.
- Works across multiple financial markets.
- Can be adapted to different trading timeframes.
- Can be combined with other technical indicators.
Limitations of Keltner Channels
Despite their advantages, Keltner Channels are not perfect.
Because the indicator relies on moving averages and historical volatility, it can produce lagging signals.
During sideways markets, price can repeatedly cross the middle EMA, generating false entries. During strong trends, mean-reversion strategies can also fail because price may remain near an outer channel for an extended period.
For this reason, traders should avoid using Keltner Channels in isolation.
Proper position sizing, stop-loss management, risk-to-reward analysis, and market-condition analysis remain essential components of a complete trading system.
Final Thoughts on Keltner Channels
By combining an EMA with ATR-based volatility bands, Keltner Channels provide a straightforward way to analyze trend direction, volatility, breakouts, pullbacks, and potential trading opportunities.
Whether you trade Forex, stocks, commodities, indices, or cryptocurrencies, the Keltner Channel indicator can become a useful component of a broader technical analysis system.
The key is not to treat the upper or lower channel as an automatic buy or sell signal. Instead, combine Keltner Channels with market structure, price action, support and resistance, multi-timeframe analysis and disciplined risk management.
Before using any Keltner Channel trading strategy with real money, traders should test the strategy on historical data and a demo account to understand its strengths, weaknesses, drawdowns, and performance under different market conditions.