
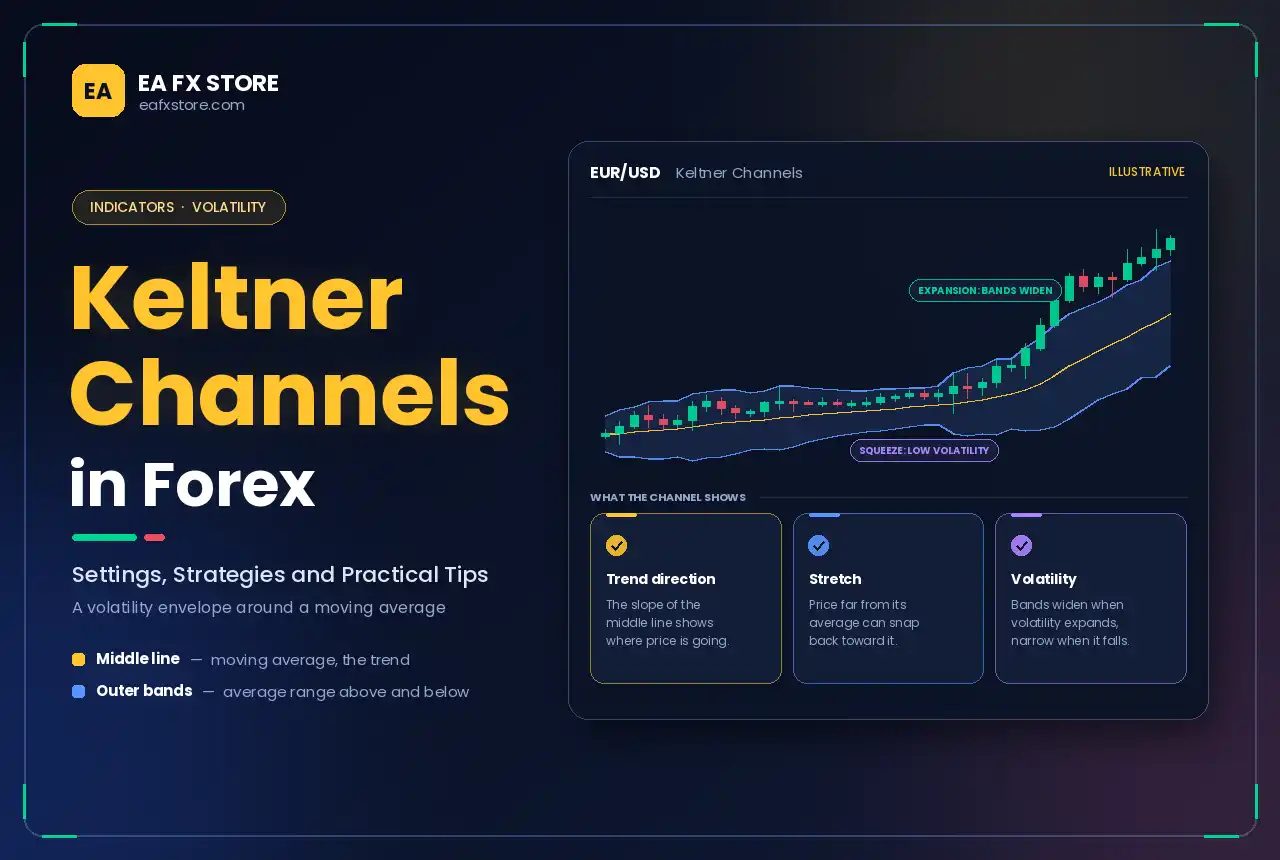
Price rarely moves in a straight line. It trends, pulls back, stretches too far and snaps back. Keltner Channels help you see all of this on one chart by drawing a volatility-based envelope around a moving average. They show the direction of the trend, how far price has stretched from its average and when volatility is expanding or contracting.
This guide explains what Keltner Channels are, how they are calculated, which settings to use and how to trade them in the Forex market.
What are Keltner Channels?
Keltner Channels are a technical indicator made of three lines:
- Middle line: an Exponential Moving Average (EMA) of price.
- Upper band: the middle line plus a multiple of the Average True Range (ATR).
- Lower band: the middle line minus the same multiple of ATR.
The indicator is named after Chester Keltner, who described an early version in his 1960 book on commodity trading. His original method used a simple moving average of the typical price and the average daily range. The modern version, using an EMA and ATR, was popularised later by traders including Linda Raschke and is the one most platforms use today.
Because the bands are based on ATR, they widen when the market becomes more volatile and narrow when it calms down.
How Keltner Channels Are Calculated
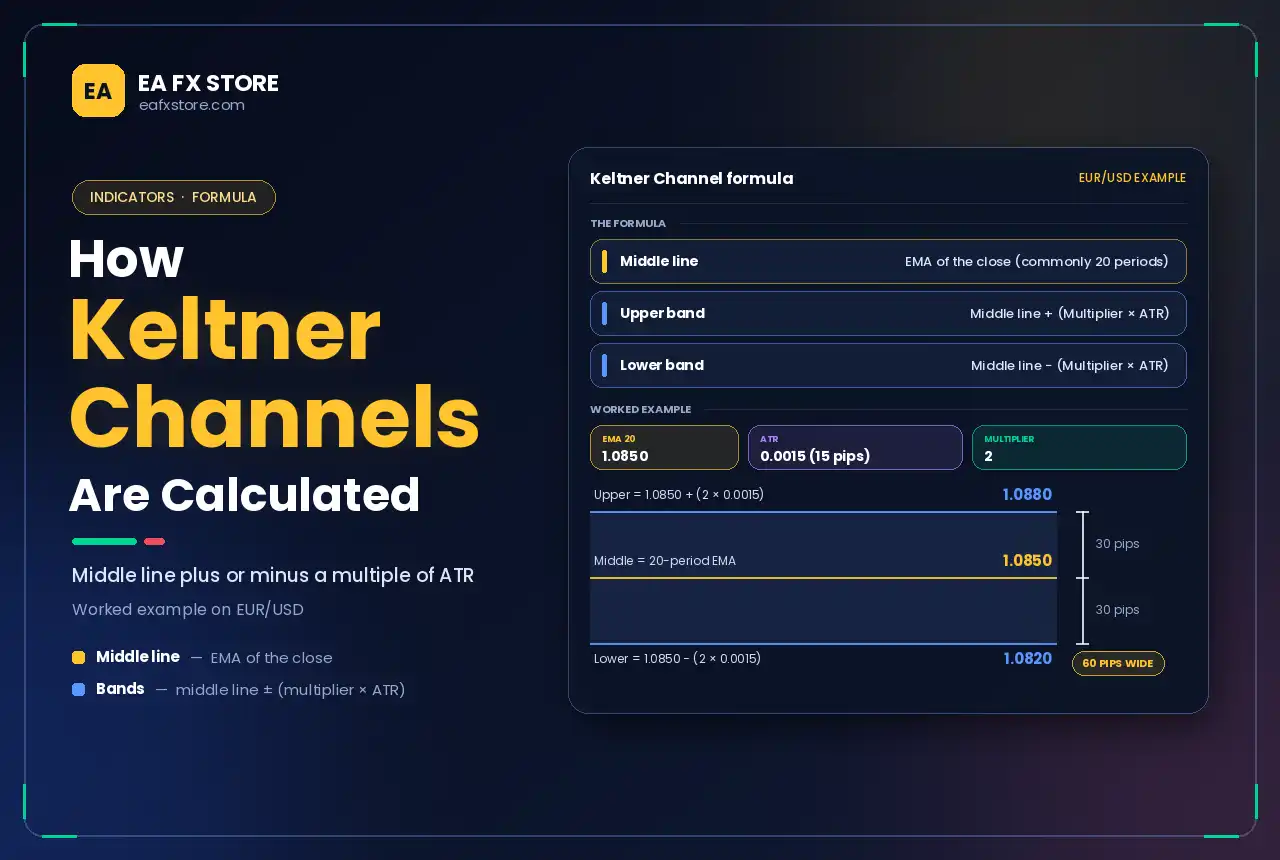
The standard modern formula is:
- Middle line = EMA of the close (commonly 20 periods)
- Upper band = Middle line + (Multiplier × ATR)
- Lower band = Middle line − (Multiplier × ATR)
Example: on EUR/USD, if the 20-period EMA is 1.0850, the ATR is 0.0015 (15 pips) and the multiplier is 2:
- Upper band = 1.0850 + (2 × 0.0015) = 1.0880
- Lower band = 1.0850 − (2 × 0.0015) = 1.0820
The channel is therefore 60 pips wide, reflecting current volatility.
Keltner Channel Settings
| Setting | Common default | Effect of changing it |
| EMA period | 20 | Shorter reacts faster; longer is smoother |
| ATR period | 10 to 20 | Shorter reacts faster to volatility changes |
| Multiplier | 2.0 | Higher widens the channel and gives fewer touches |
Many traders use EMA 20, ATR 10, multiplier 2 as a starting point. Some add a second set of bands at a multiplier of 1 and 3 to create zones of normal, stretched and extreme price movement.
Keltner Channels are available as a built-in indicator on platforms such as TradingView. On MetaTrader 4 and 5, they are usually added as a custom indicator, and many versions let you choose the moving average type and ATR settings.
How to Read Keltner Channels
- Channel direction: a rising channel shows an uptrend; a falling channel shows a downtrend; a flat channel suggests a range.
- Price above the middle line: buyers are in control. Price below it: sellers are in control.
- Price riding the upper band: a strong bullish trend. Riding the lower band: a strong bearish trend.
- Close outside the channel: a sign of strong momentum, often at the start of a breakout or near the end of an exhausted move.
- Channel width: widening bands show rising volatility; narrowing bands show falling volatility.
Keltner Channel Trading Strategies
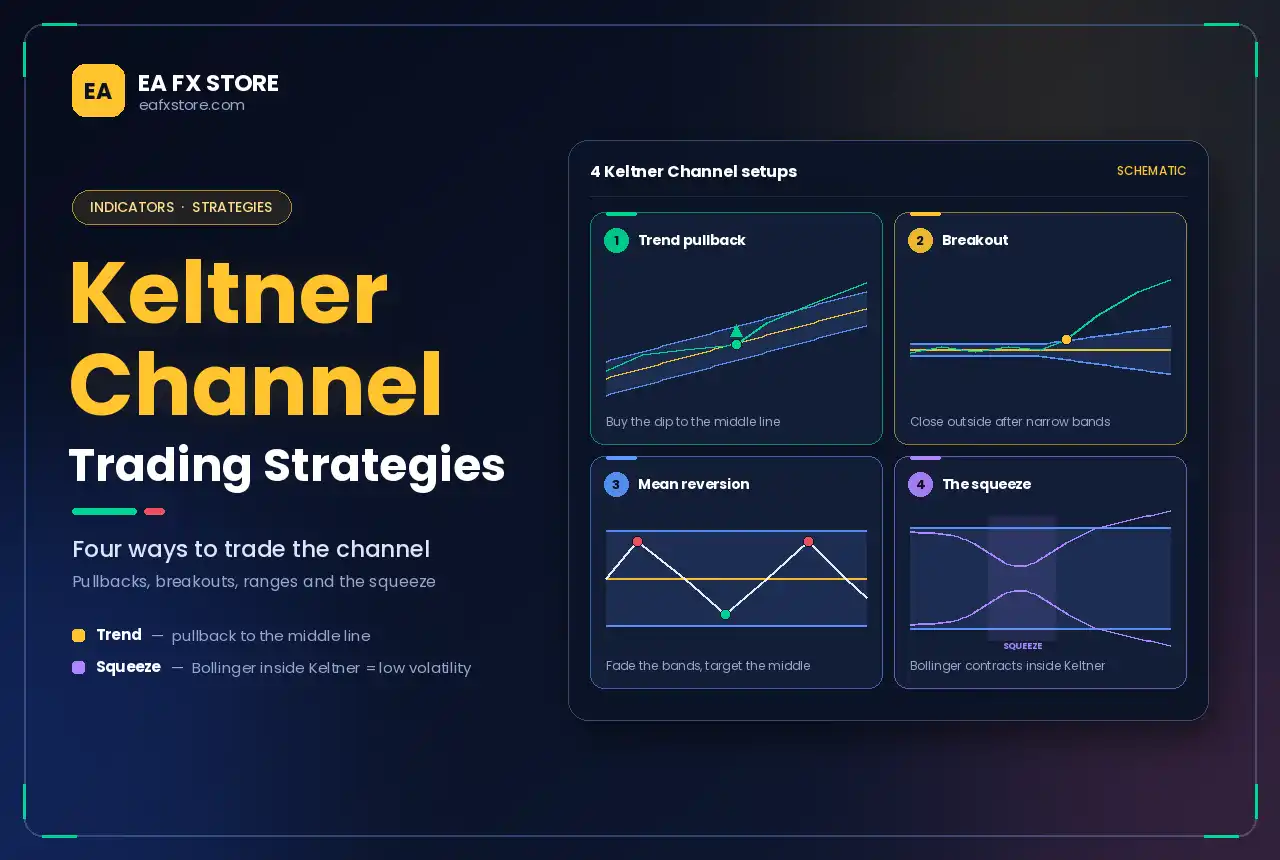
1. Trend pullback to the middle line
This is the most popular use of Keltner Channels.
- Confirm the trend: the channel slopes up and price stays mostly above the middle line.
- Wait for price to pull back to the middle EMA, or into the area between the middle line and the lower band.
- Look for a bullish reaction, such as a rejection candle or a break of a minor swing high. Reading price action carefully helps here.
- Enter long, with a stop below the pullback low or below the lower band.
- Target the upper band, or trail the stop below the middle line while the trend continues.
Reverse the rules for downtrends.
2. Breakout strategy
When price closes outside the channel after a period of narrow bands, it often signals the start of a new move.
- Look for a channel that has been flat and narrow.
- Wait for a strong candle to close above the upper band (for longs) or below the lower band (for shorts).
- Enter on the close or on a small pullback towards the band.
- Place the stop back inside the channel, near the middle line.
- Hold while price stays outside or near the outer band.
3. Mean reversion in a range
When the channel is flat, price tends to rotate between the bands.
- Confirm that the middle line is flat and the bands are parallel.
- Sell near the upper band with signs of rejection, and buy near the lower band with signs of support.
- Target the middle line.
- Avoid this approach when the channel starts to slope strongly, as ranges often end in breakouts.
4. The Keltner squeeze
The squeeze combines Keltner Channels with Bollinger Bands. Bollinger Bands use standard deviation, while Keltner Channels use ATR. When the Bollinger Bands contract inside the Keltner Channels, volatility is unusually low. This compression often comes before a strong expansion.
Traders mark these squeeze periods and wait for the Bollinger Bands to expand back outside the Keltner Channels, then trade in the direction of the breakout. Popular squeeze indicators, such as the TTM Squeeze developed by John Carter, are built on this idea.
Keltner Channels vs Bollinger Bands
| Feature | Keltner Channels | Bollinger Bands |
| Middle line | EMA | SMA |
| Band width based on | ATR (average range) | Standard deviation of closes |
| Band behaviour | Smoother, more stable | Reacts sharply to price spikes |
| Typical use | Trend following, pullbacks | Volatility and mean reversion |
Neither is better in every situation. Keltner Channels tend to give cleaner trend signals, while Bollinger Bands react faster to sudden volatility changes. Used together, they power the squeeze strategy.
Combining Keltner Channels With Other Tools
- Market structure: take pullback entries only when the trend is confirmed by higher highs and higher lows, or after a change in structure as described in Smart Money Concepts.
- Key levels: a touch of the lower band that lines up with the Point of Control or an order block offers stronger confluence.
- Liquidity: a spike outside the channel that immediately returns inside may be a liquidity sweep rather than a real breakout.
- Volume: a breakout with rising volume is more convincing, a principle at the heart of Volume Spread Analysis.
Keltner Channels in Expert Advisors
Because Keltner Channels follow clear rules, they are widely used in EAs for trend filters, breakout entries and trailing stops. When building or testing one:
- Use closed candles for signals to avoid unrealistic backtests.
- Test several multipliers, as small changes affect how often trades trigger.
- Add a trend filter to avoid mean-reversion trades during strong breakouts.
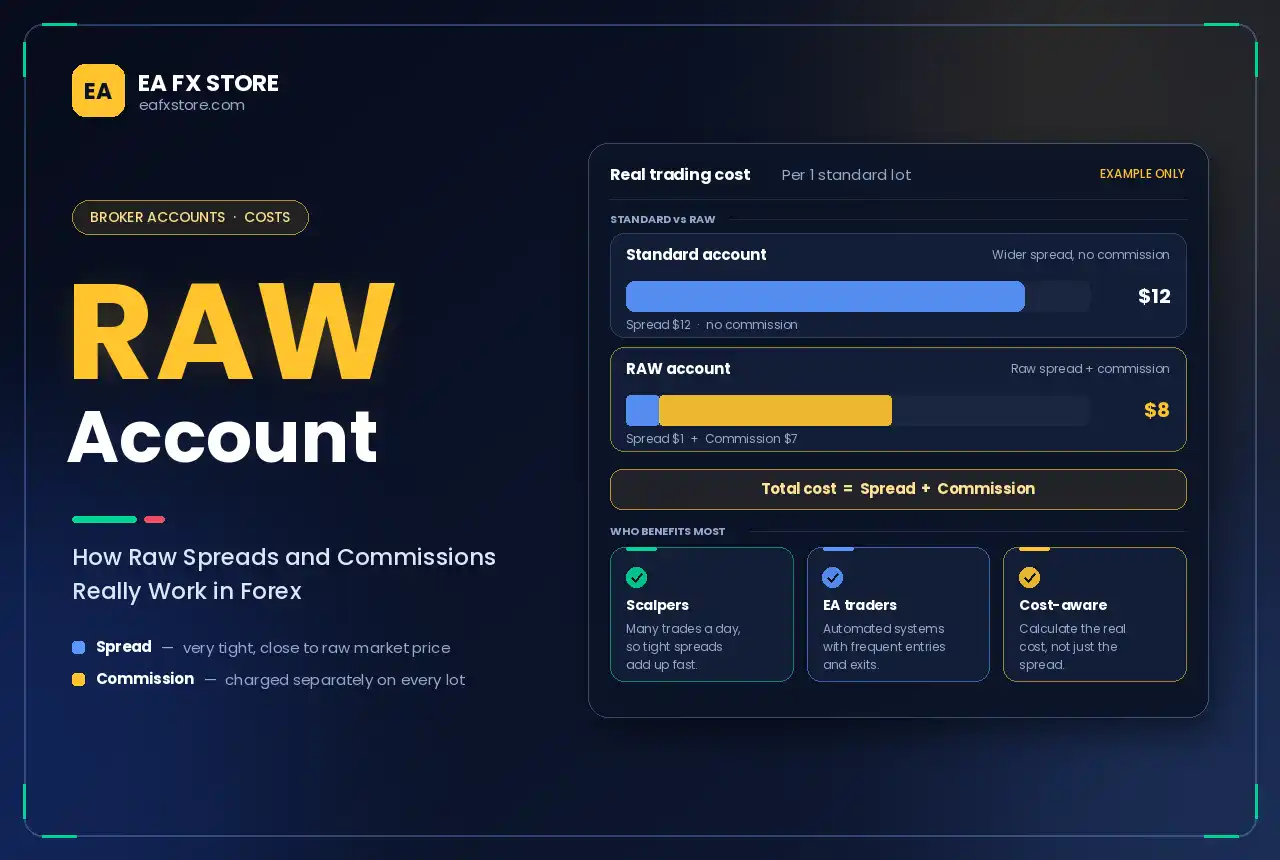
- Include realistic spreads and commissions in backtests.
- Manage risk with fixed risk per trade. See our risk management tips.
Limitations of Keltner Channels
- Lag: both the EMA and ATR are based on past data.
- Mixed signals: a close outside the band can mean a breakout or an exhausted move, so context is essential.
- Whipsaws in choppy markets, especially around news releases.
- Settings matter: results vary with the EMA period, ATR period and multiplier.
Frequently Asked Questions
What are Keltner Channels?
They are a volatility indicator with an EMA middle line and upper and lower bands set at a multiple of ATR.
What are the best Keltner Channel settings?
A common starting point is a 20-period EMA, a 10-period ATR and a multiplier of 2. Adjust them to your timeframe and pair.
What is the difference between Keltner Channels and Bollinger Bands?
Keltner Channels use ATR for band width and are smoother; Bollinger Bands use standard deviation and react faster to price spikes.
What does it mean when price closes outside the Keltner Channel?
It shows strong momentum. In a breakout it can signal the start of a trend; after a long move it can warn of exhaustion.
Conclusion
Keltner Channels combine trend direction and volatility in one simple tool. Use the middle line for trend pullbacks, the outer bands for breakouts and ranges, and the squeeze with Bollinger Bands to spot periods of compression before big moves. Combine Keltner signals with market structure, key levels and solid risk management to trade them with confidence.
Risk warning: Trading Forex and CFDs on margin carries a high level of risk and may not be suitable for all investors. This article is for educational purposes only and is not investment advice.