
The Relative Vigor Index (RVI) is a popular technical analysis indicator designed to measure the strength and direction of a market trend. By comparing the relationship between an asset’s closing price and its trading range, the RVI helps traders identify bullish and bearish momentum and potential trend reversals.
Unlike indicators that focus primarily on price levels, the RVI attempts to determine whether buyers or sellers have greater control of the market. This makes it particularly useful for traders looking for confirmation of trend direction, momentum changes, and possible entry or exit opportunities.
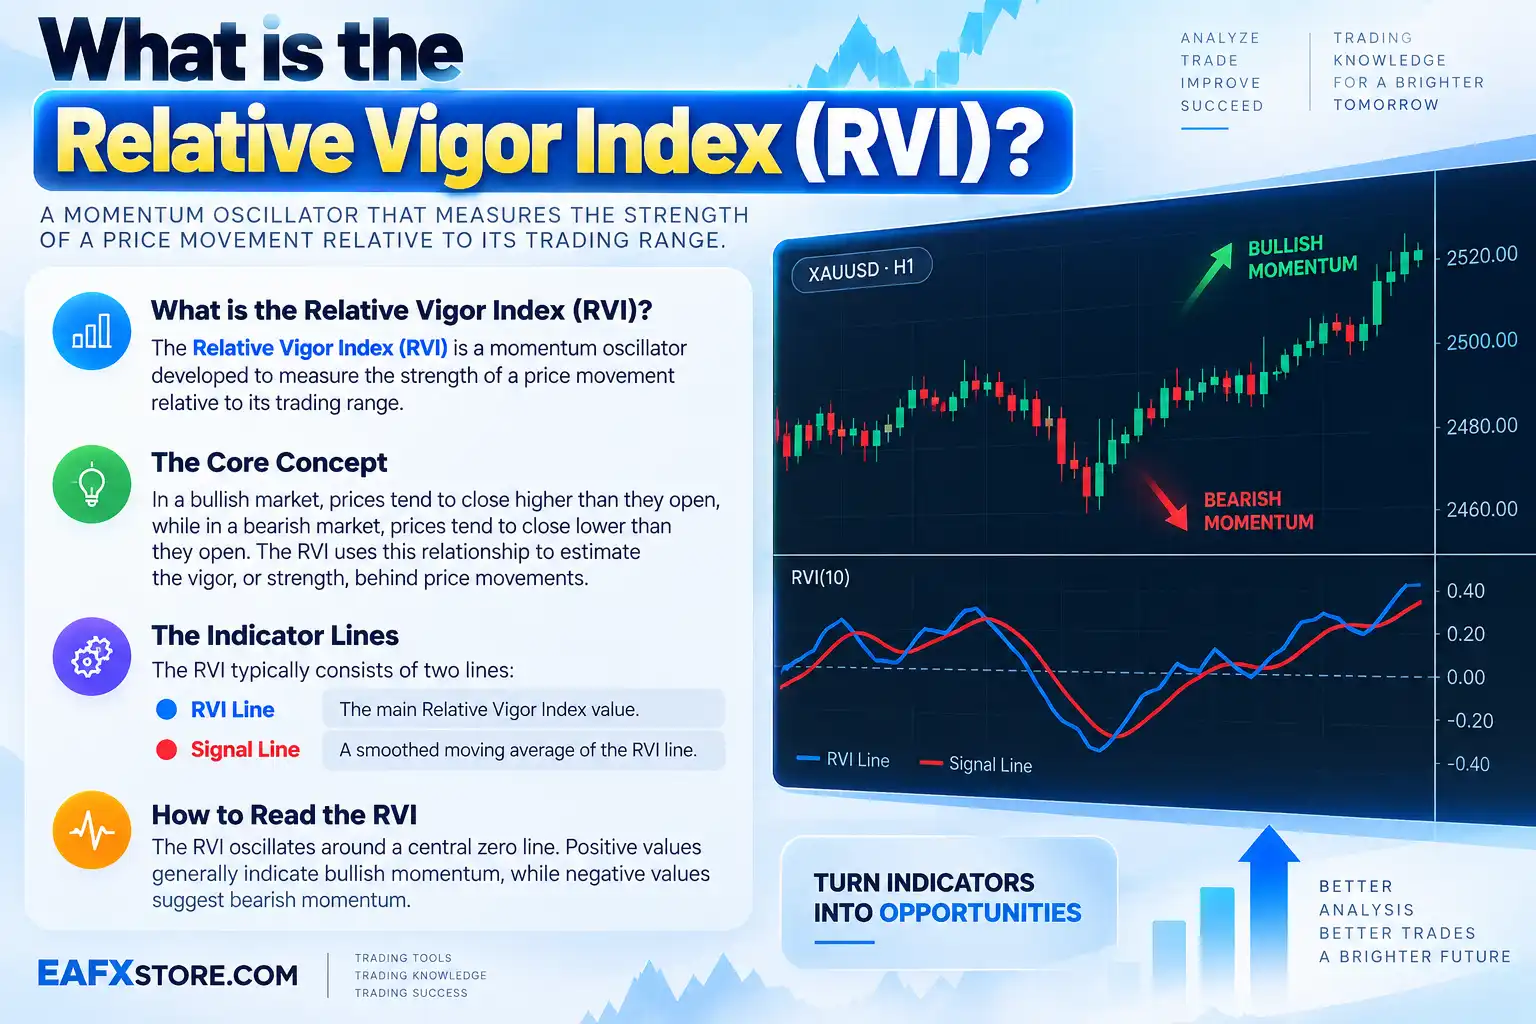
What is the Relative Vigor Index (RVI)?
The Relative Vigor Index (RVI) is a momentum oscillator developed to measure the strength of a price movement relative to its trading range.
The underlying concept is relatively simple: in a bullish market, prices tend to close higher than they open, while in a bearish market, prices tend to close lower than they open. The RVI uses this relationship to estimate the vigor, or strength, behind price movements.
The indicator typically consists of two lines:
- RVI Line: The main Relative Vigor Index value.
- Signal Line: A smoothed moving average of the RVI line.
The RVI oscillates around a central zero line. Positive values generally indicate bullish momentum, while negative values suggest bearish momentum.
How Does the RVI Indicator Work?
The RVI compares the difference between the closing and opening prices with the trading range between the high and low prices.
A simplified version of the RVI calculation can be represented as:
RVI = Average of (Close − Open) / (High − Low)
In practice, most charting platforms use a more sophisticated smoothing process involving weighted moving averages. The commonly used default setting is a 10-period RVI, although traders can adjust the period depending on their strategy and timeframe.
The calculation is designed to reduce short-term market noise while maintaining information about the underlying momentum.
When the RVI rises above zero, it suggests that bullish pressure is becoming stronger. Conversely, when it moves below zero, bearish pressure may be increasing.
How to Read the Relative Vigor Index
Understanding the RVI is relatively straightforward once traders become familiar with its key signals.
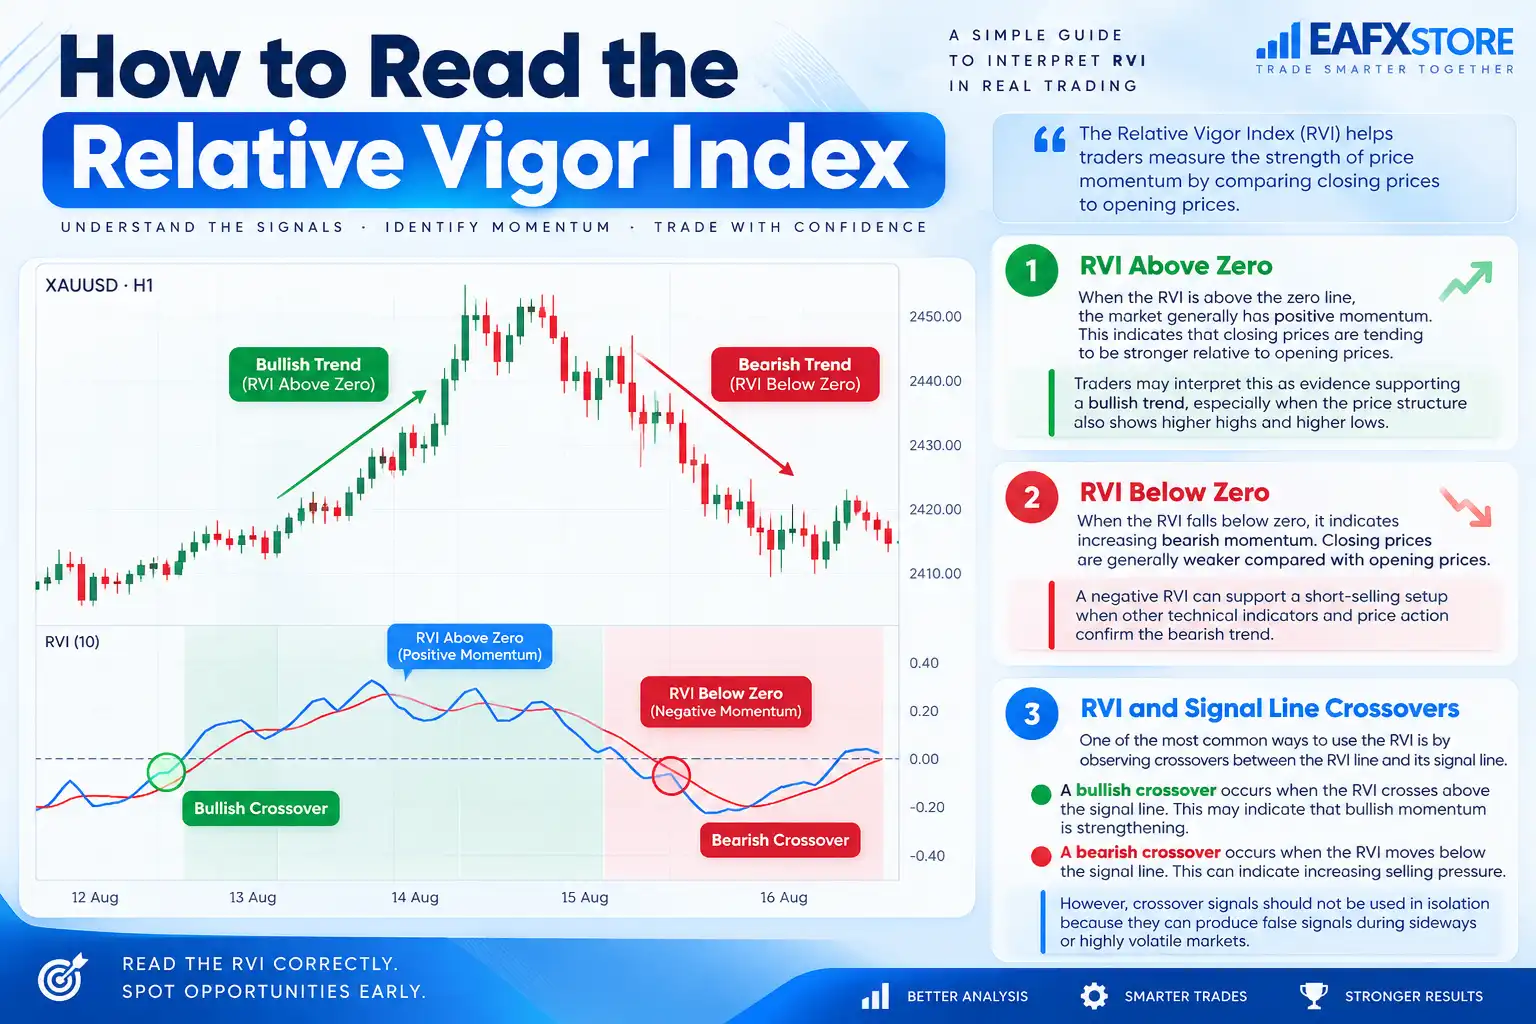
1. RVI Above Zero
When the RVI is above the zero line, the market generally has positive momentum. This indicates that closing prices are tending to be stronger relative to opening prices.
Traders may interpret this as evidence supporting a bullish trend, especially when the price structure also shows higher highs and higher lows.
2. RVI Below Zero
When the RVI falls below zero, it indicates increasing bearish momentum. Closing prices are generally weaker compared with opening prices.
A negative RVI can support a short-selling setup when other technical indicators and price action confirm the bearish trend.
3. RVI and Signal Line Crossovers
One of the most common ways to use the RVI is by observing crossovers between the RVI line and its signal line.
A bullish crossover occurs when the RVI crosses above the signal line. This may indicate that bullish momentum is strengthening.
A bearish crossover occurs when the RVI moves below the signal line. This can indicate increasing selling pressure.
However, crossover signals should not be used in isolation because they can produce false signals during sideways or highly volatile markets.
RVI Divergence: Identifying Potential Reversals
Another important application of the Relative Vigor Index is divergence analysis.
Bullish divergence occurs when the price forms lower lows while the RVI forms higher lows. This can indicate that bearish momentum is weakening and that a potential upward reversal may be developing.
Bearish divergence occurs when price creates higher highs while the RVI forms lower highs. This suggests that bullish momentum may be losing strength and that a downward reversal could become more likely.
Divergence is particularly useful when combined with important support and resistance levels or recognizable price-action patterns.
How to Use RVI in a Trading Strategy
The RVI can be incorporated into many different trading approaches, including trend following, swing trading and scalping.
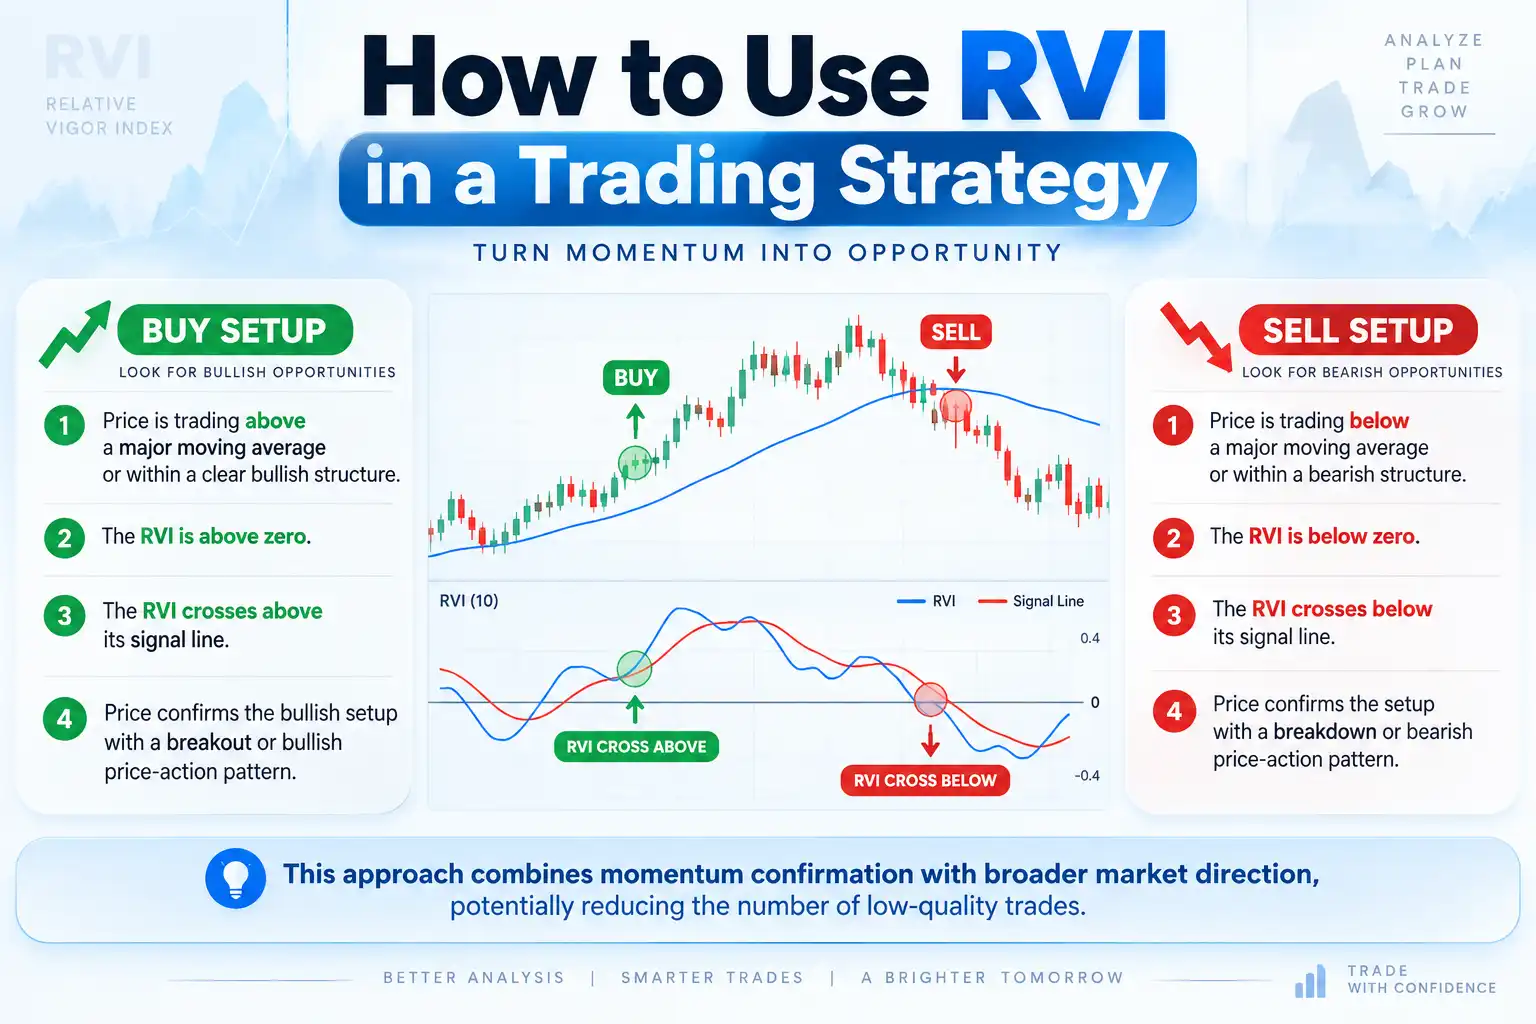
A basic RVI trend-following strategy can use the following conditions:
Buy setup:
- Price is trading above a major moving average or within a clear bullish structure.
- The RVI is above zero.
- The RVI crosses above its signal line.
- Price confirms the bullish setup with a breakout or bullish price-action pattern.
Sell setup:
- Price is trading below a major moving average or within a bearish structure.
- The RVI is below zero.
- The RVI crosses below its signal line.
- Price confirms the setup with a breakdown or bearish price-action pattern.
This approach combines momentum confirmation with broader market direction, potentially reducing the number of low-quality trades.
RVI for Forex and Gold Trading
The Relative Vigor Index can be applied to a wide range of financial markets, including Forex, stocks, indices, commodities, and cryptocurrencies.
For Forex traders, the RVI can help identify momentum shifts in major currency pairs. On instruments such as XAUUSD (Gold), traders can use the indicator to confirm whether a short-term price movement has sufficient momentum to support a potential trade.
Because Gold can experience sharp price movements, traders should avoid relying solely on RVI crossovers. Combining RVI signals with market structure, support and resistance, and proper risk management can provide a more balanced trading approach.
Advantages of the Relative Vigor Index
The RVI offers several advantages:
- Simple momentum interpretation: Positive and negative readings make trend direction easy to understand.
- Useful crossover signals: RVI and signal-line crossovers can help identify momentum changes.
- Divergence detection: The indicator can highlight potential weakening trends.
- Versatile application: It can be used across different markets and timeframes.
- Trend confirmation: RVI can complement price action and other technical indicators.
These characteristics make the RVI a useful addition to a technical trader's toolkit.
Limitations of the RVI Indicator
Despite its advantages, the RVI is not a perfect trading indicator.
The biggest limitation is that it can generate false signals in sideways markets. Because the RVI is a momentum oscillator, rapid changes in price can cause frequent crossovers without producing meaningful trends.
The RVI is also a lagging technical indicator because it is calculated from historical price data. Therefore, traders should not expect it to predict market movements with certainty.
For better results, RVI signals should be confirmed using market structure, price action, support and resistance, volume, or other complementary technical tools.
Best RVI Settings
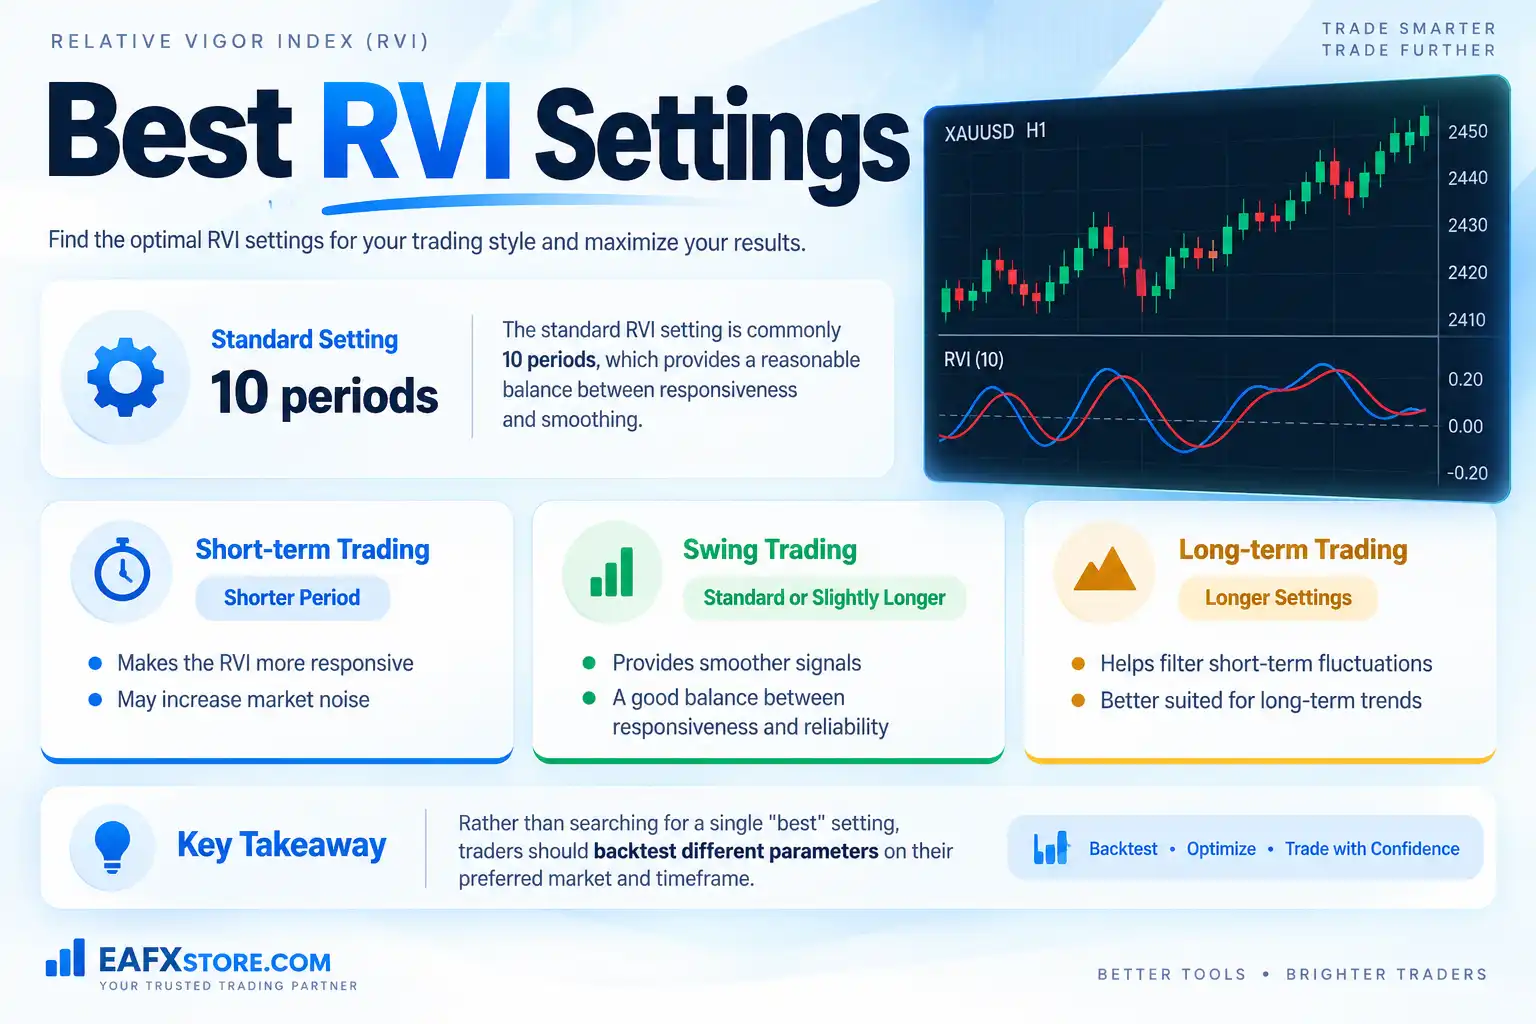
The standard RVI setting is commonly 10 periods, which provides a reasonable balance between responsiveness and smoothing.
However, the optimal setting depends on the trader's strategy:
- Short-term trading: A shorter period can make the RVI more responsive but may increase market noise.
- Swing trading: A standard or slightly longer period can provide smoother signals.
- Long-term trading: Longer settings may help filter short-term fluctuations.
Rather than searching for a single "best" setting, traders should backtest different parameters on their preferred market and timeframe.
RVI vs. Other Momentum Indicators
The RVI is sometimes compared with indicators such as the Relative Strength Index (RSI) and Moving Average Convergence Divergence (MACD).
The RSI primarily measures the speed and magnitude of price changes and is widely used to identify overbought and oversold conditions. MACD focuses on the relationship between moving averages and is commonly used for trend and momentum analysis.
The RVI takes a different approach by emphasizing the relationship between the opening and closing prices within the trading range.
As a result, RVI can complement RSI and MACD rather than necessarily replacing them.
Final Thoughts
The Relative Vigor Index (RVI) is a useful momentum indicator for traders who want to evaluate trend strength and identify potential changes in market direction. Its zero-line readings, signal-line crossovers, and divergence patterns provide several ways to analyze price momentum.
However, no technical indicator can guarantee profitable trades. The most effective way to use the RVI is as part of a broader trading system that includes market structure, price action, confirmation signals and disciplined risk management.
Whether you trade Forex, Gold, stocks, indices, or cryptocurrencies, understanding how the RVI works can help you develop a more structured approach to technical analysis.
For traders searching for a simple but flexible momentum tool, the Relative Vigor Index (RVI) is certainly an indicator worth learning and testing.