
What is the HiLo Indicator?
The term HiLo is used for several indicators built from recent highs and lows. The most popular is the Gann HiLo Activator, introduced by trader Robert Krausz in the late 1990s and inspired by the work of W.D. Gann.
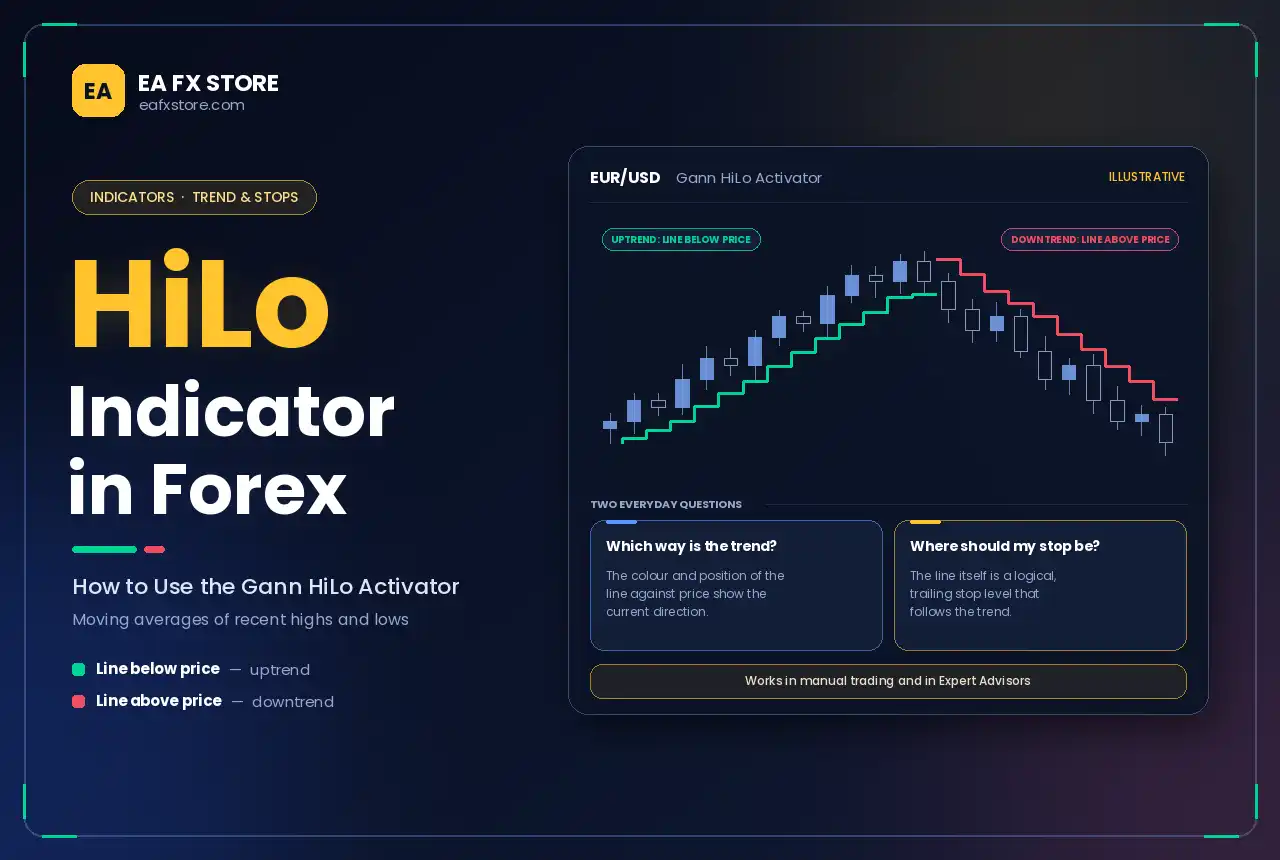
The HiLo Activator draws a single line that switches sides of price:
In an uptrend, the line sits below price and follows the average of recent lows.
In a downtrend, the line sits above price and follows the average of recent highs.
When price closes through the line, the trend is considered to have changed, and the line jumps to the other side. Many versions colour the line green for bullish and red for bearish, making the trend visible at a glance.
You may also see HiLo channels or HiLo bands, which plot both the moving average of highs and the moving average of lows at the same time. These work similarly to a moving average envelope. This article focuses on the Activator, which is the version most traders mean when they say “HiLo”.
How the HiLo Activator Is Calculated
The calculation uses two simple moving averages (SMAs), usually of a short period such as 3:
HiLo High = SMA of the high over N periods
HiLo Low = SMA of the low over N periods
The switching rules are:
If the close is above the previous HiLo High, the trend turns bullish, and the indicator plots the HiLo Low below price.
If the close is below the previous HiLo Low, the trend turns bearish, and the indicator plots the HiLo High above price.
If neither happens, the indicator keeps the current trend and line.
Example: on a one-hour EUR/USD chart with N = 3, suppose the last three highs average 1.0872 and the last three lows average 1.0846. The market is in a downtrend, so the line sits at 1.0872. If the next candle closes at 1.0878, above 1.0872, the trend flips to bullish and the line moves below price to the average of the lows.
HiLo Settings
Setting | Common values | Effect |
Period (N) | 3 (classic), 5–10, 20+ | Short periods react fast; longer periods are smoother |
MA type | SMA (classic), EMA | EMA reacts faster to recent bars |
Signal on | Candle close | Using closes avoids flips from intrabar spikes |
The classic Krausz setting is a 3-period SMA, which suits short-term swing and intraday trading. Many Forex traders use 8 to 13 on lower timeframes to reduce noise, or 20 or more on higher timeframes for longer trends.
HiLo Activators are available as custom indicators for MetaTrader 4 and 5 and as community scripts on TradingView. Versions differ in details such as the moving average type and whether they use the current or previous bar for the switch, so check the settings of the one you use.
How to Trade With the HiLo Indicator
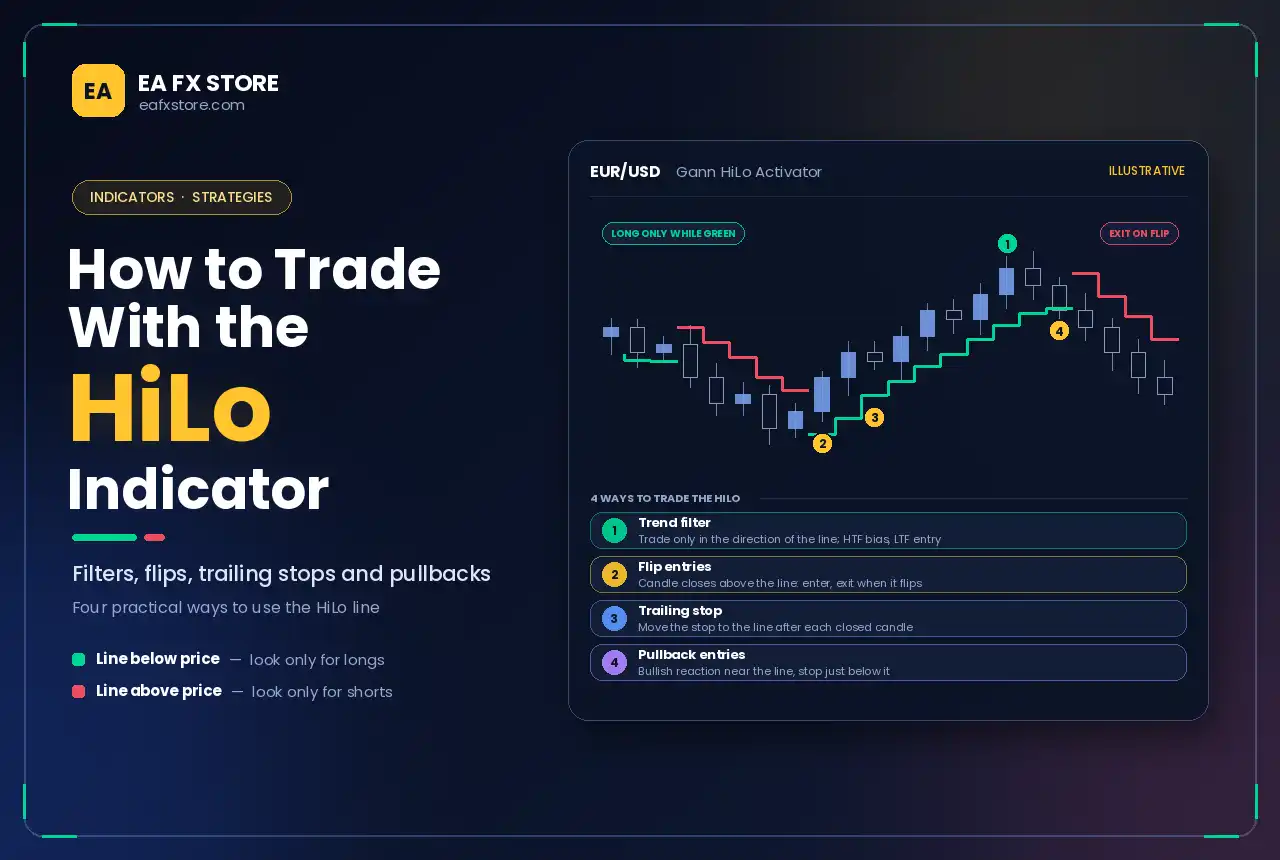
Trend direction filter
The simplest use is to trade only in the direction of the HiLo line:
Line below price (green): look only for long trades.
Line above price (red): look only for short trades.
Use a higher-timeframe HiLo to set the bias and a lower-timeframe setup for entries. For example, a four-hour HiLo in bullish mode combined with a one-hour price action entry.
Flip entries
Some traders enter when the HiLo flips:
Wait for a candle to close above the HiLo line, turning it bullish.
Enter long at the close or on a small pullback.
Place the stop below the new HiLo line or the recent swing low.
Exit when the line flips bearish.
This approach catches trends early but produces false signals in ranges, so it works best with a trend filter, such as a longer moving average or higher-timeframe structure.
Trailing stop
The HiLo line is an excellent trailing stop. In a long trade, move your stop to the HiLo line after each closed candle. As price rises, the line rises with it, locking in profit. When price closes below the line, the trade is closed. Because the line follows recent lows, it gives the trend room to breathe without giving back too much.
Pullback entries in a trend
In a strong uptrend, price often pulls back towards the HiLo line without closing below it. Traders look for bullish reaction candles near the line as low-risk entries, with the stop just below it.
Combining HiLo With Other Tools
Market structure: confirm HiLo flips with a break of a swing high or low, an idea central to Smart Money Concepts.
Key levels: a HiLo flip at a strong level, such as the Point of Control or an order block, is more reliable than one in the middle of a range.
Liquidity: a flip triggered by a quick spike that reverses may be a liquidity sweep, not a real trend change.
Volume: a flip on rising volume carries more conviction, a principle explored in Volume Spread Analysis.
ICT concepts: some traders use HiLo as a simple bias tool alongside ICT trading setups.
HiLo in Expert Advisors
Because its rules are clear and objective, the HiLo indicator is popular in EAs as a trend filter, entry trigger or trailing stop. When building or testing one:
Use closed bars only. The live candle can flip the line back and forth before it closes.
Check the switching logic. Confirm whether the indicator compares the close with the current or the previous HiLo value.
Add a range filter. HiLo flips often in sideways markets, so combine it with ADX, a longer moving average or a volatility filter.
Test several periods across different pairs and timeframes, and avoid over-optimising.
Include realistic costs and apply sound risk management.
Advantages of the HiLo Indicator
Simple and objective: one line, clear rules.
Clear trend direction at a glance.
Built-in trailing stop that adapts to price.
Works on all timeframes and instruments.
Easy to code for EAs and alerts.
Limitations of the HiLo Indicator
Whipsaws in ranges: frequent flips in sideways markets lead to losses.
Lag: as a moving-average tool, it reacts after price has already moved.
Short periods are noisy; long periods are slow.
Different versions behave differently, so backtest the exact indicator you use.
Frequently Asked Questions
What is the HiLo indicator?
It is a trend indicator that uses moving averages of recent highs and lows. The Gann HiLo Activator plots one line that switches above or below price as the trend changes.
Who created the Gann HiLo Activator?
It was introduced by trader Robert Krausz, inspired by the methods of W.D. Gann.
What is the best HiLo setting?
The classic setting is a 3-period moving average. Many Forex traders use 8 to 13 on lower timeframes or 20 and above for longer trends.
Can the HiLo indicator be used as a trailing stop?
Yes. Moving your stop to the HiLo line after each closed candle is one of its most common uses.
Conclusion
The HiLo indicator turns recent highs and lows into a simple, powerful trend tool. Use it to define direction, time entries when the line flips or price pulls back to it, and trail stops to protect profits. Add a range filter and key-level confirmation to avoid whipsaws, and always test the exact version you use before trading live.
Risk warning: Trading Forex and CFDs on margin carries a high level of risk and may not be suitable for all investors. This article is for educational purposes only and is not investment advice.