Understanding supply and demand zones is one of the most powerful ways to read price action in the Forex market. Unlike traditional indicators, this approach focuses on where institutional traders are likely placing large orders—giving you a clearer edge in predicting price movements.
In this beginner-friendly guide, you’ll learn what supply and demand zones are, how to identify them, and how to trade them step by step.
What Are Supply and Demand Zones?
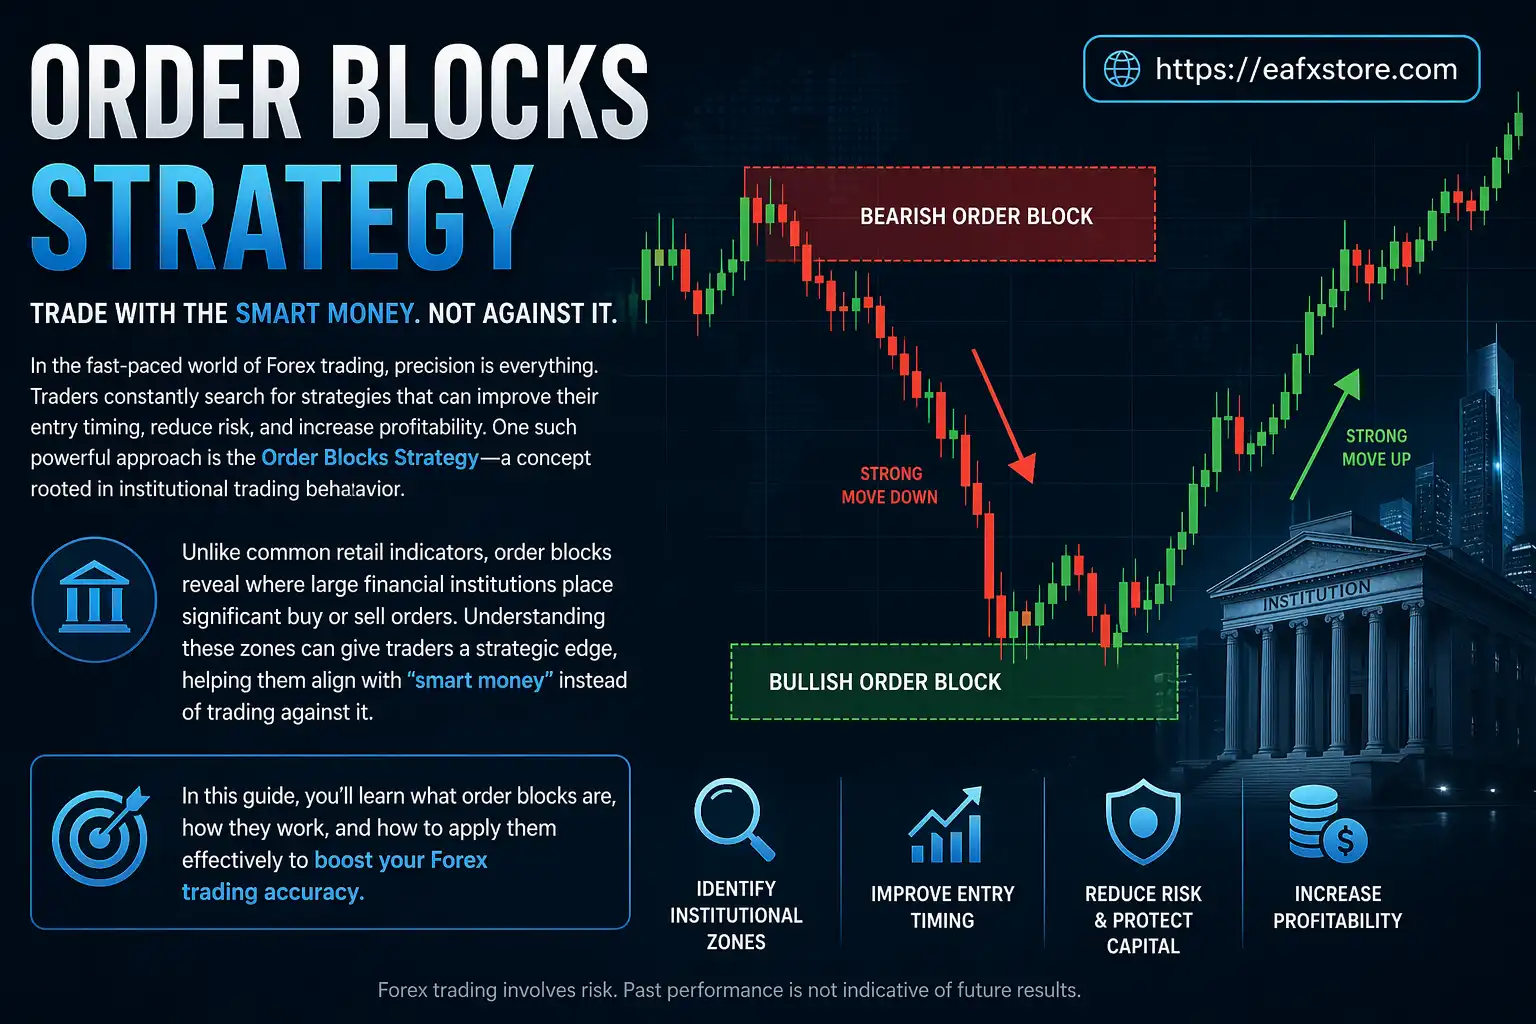
Supply and demand zones are areas on a price chart where strong buying or selling has previously occurred.
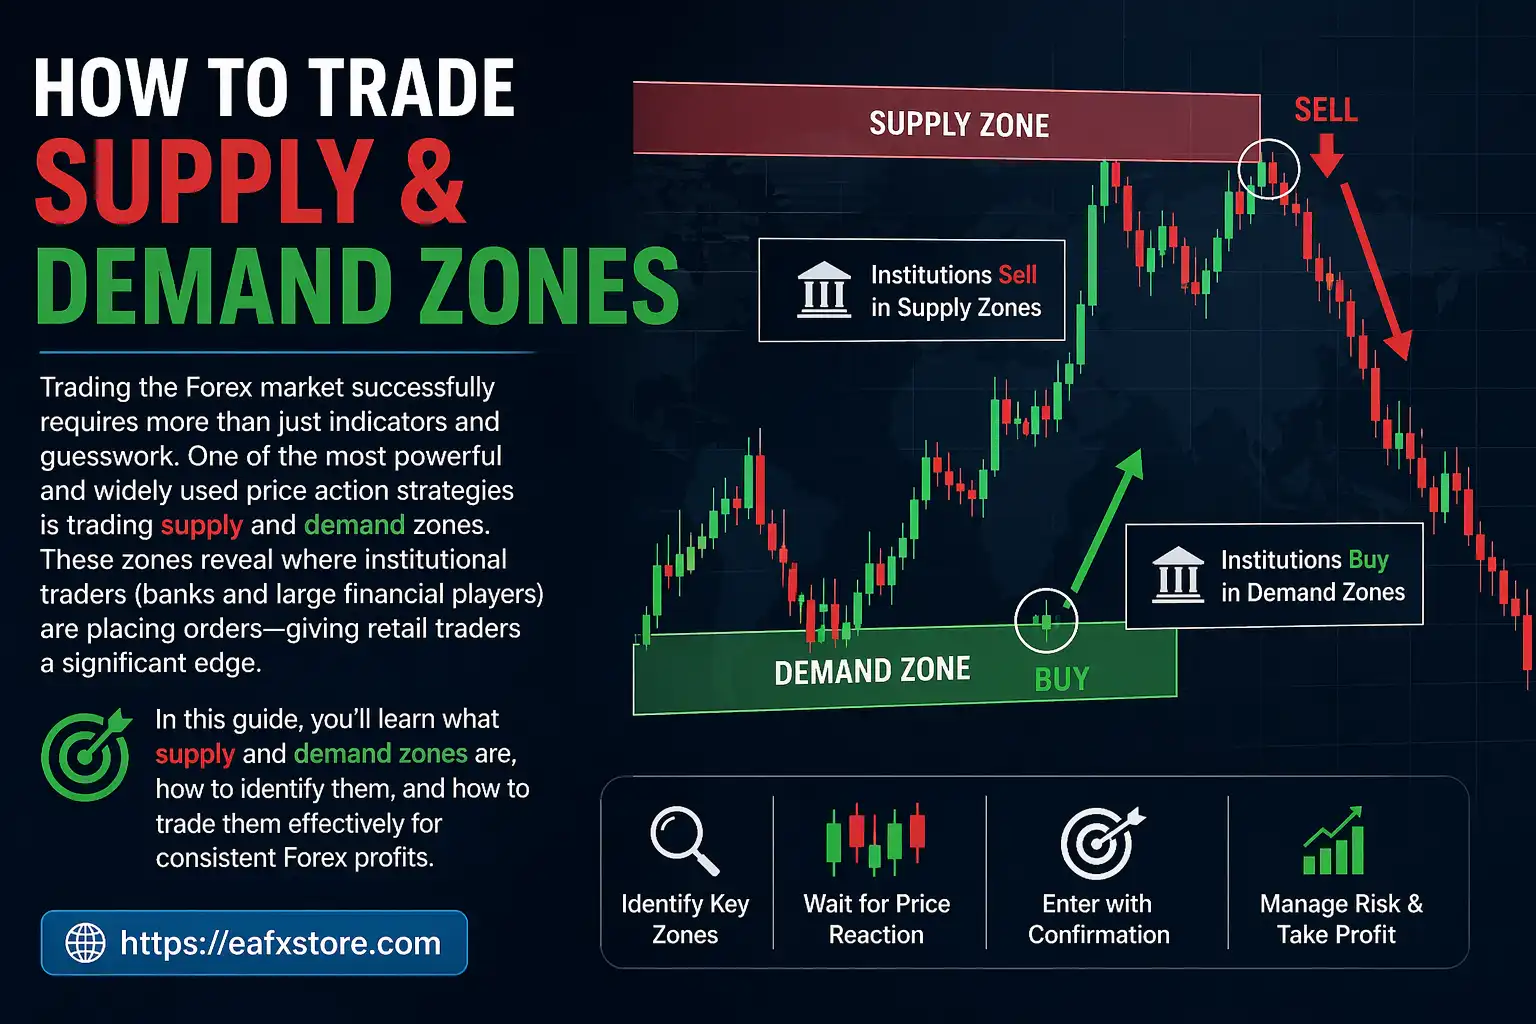
- Demand Zone: A price level where buyers were strong enough to push the market upward.
- Supply Zone: A price level where sellers overwhelmed buyers and pushed prices downward.
These zones often act as support and resistance, but with more context—they show why price reacted, not just where.

Why Supply and Demand Zones Matter
Financial markets move because of imbalances between buyers and sellers. When demand exceeds supply, prices rise. When supply exceeds demand, prices fall.
Supply and demand zones help you:
- Identify high-probability entry points.
- Avoid chasing the market.
- Understand institutional behavior.
- Improve risk-to-reward ratios.
Instead of reacting late, you anticipate where price is likely to turn.
Key Characteristics of Strong Zones
Not all zones are equal. Strong supply and demand zones share certain characteristics:
- Strong Price Movement Away: A good zone is followed by a sharp move (impulse).
- Minimal Time Spent in Zone: The less time price stays in a zone, the stronger the imbalance.
- Freshness: Zones that haven’t been retested are more reliable.
- Clear Structure: Look for clean formations like “base + breakout.”
Types of Supply and Demand Patterns
There are four basic patterns you should know:
| Pattern | Meaning | Direction |
|---|---|---|
| Rally → Base → Rally (RBR) | Continuation of bullish trend | Buy |
| Drop → Base → Drop (DBD) | Continuation of bearish trend | Sell |
| Rally → Base → Drop (RBD) | Reversal to bearish | Sell |
| Drop → Base → Rally (DBR) | Reversal to bullish | Buy |
These patterns help you quickly identify zones on any timeframe.

Step-by-Step Guide to Identify Zones
Step 1: Identify Strong Moves
Look for large bullish or bearish candles that move quickly away from a level.
- Big candles = strong imbalance
- Small candles = weak signal
Step 2: Locate the Base
The base is the consolidation area before the move.
It usually appears as:
- Small candles
- Sideways movement
- Tight price range
This is where institutions accumulate orders.
Step 3: Mark the Zone
Draw your zone from:
- Demand zone: from the lowest wick to the body of the base
- Supply zone: from the highest wick to the body of the base
Keep it simple—don’t overcomplicate your markings.
Step 4: Wait for Price to Return
Patience is key. Let price come back to your zone.
Do not chase trades in the middle of nowhere.

How to Trade Supply and Demand Zones
Once you’ve identified a valid zone, here’s how to trade it:
Entry
- Enter when price returns to the zone.
- Look for confirmation (optional but safer), such as:
- Rejection candles.
- Engulfing patterns.
- Lower timeframe structure break.
Stop Loss
- Place stop loss beyond the zone.
- Give enough room to avoid being stopped out by noise.
Take Profit
- Target the next opposing zone.
- Or use a fixed risk-to-reward ratio (e.g., 1:2 or 1:3).

Example Trade Setup
| Element | Description |
|---|---|
| Zone Type | Demand Zone |
| Entry | At zone retest |
| Stop Loss | Below zone |
| Take Profit | Next supply zone |
| Risk-Reward | 1:3 |
This structured approach helps maintain discipline and consistency.
Common Mistakes to Avoid
- Drawing Too Many Zones: Not every level is important. Focus only on strong, clear zones.
- Ignoring Trend: Trading against the trend reduces your probability of success.
- Entering Too Early: Always wait for price to reach your zone.
- Overcomplicating Analysis: Keep your chart clean. Simplicity wins.
Tips for Beginners
- Start with higher timeframes (H1, H4, Daily).
- Practice on historical charts.
- Combine with basic price action.
- Keep a trading journal.
Consistency matters more than complexity.
Supply & Demand vs Support & Resistance
Many beginners confuse these concepts. Here’s a quick comparison:
| Concept | Focus | Key Difference |
|---|---|---|
| Support & Resistance | Price levels | Based on historical reactions |
| Supply & Demand | Order imbalance | Based on institutional activity |
Supply and demand zones provide deeper insight into why price reacts.

Best Timeframes to Use
- Higher Timeframes (H4, Daily): Strong, reliable zones.
- Lower Timeframes (M15, M5): Precise entries.
A common strategy is:
- Identify zones on higher timeframe.
- Enter on lower timeframe.
Final Thoughts
Supply and demand zones offer a clean, logical way to understand the Forex market. Instead of relying on lagging indicators, you’re analyzing real market behavior—where buyers and sellers truly interact.
As a beginner, focus on mastering the basics:
- Identify strong zones.
- Wait for price to return.
- Manage risk properly.
Over time, your ability to read the market will improve significantly.