

The Forex market moves in recognizable patterns driven by trader psychology, economic events, and market sentiment. One of the most respected methods for identifying these patterns is the Elliott Wave Theory. Developed by Ralph Nelson Elliott in the 1930s, this trading approach helps traders predict potential market movements using repetitive wave structures.
In Forex trading, understanding Elliott Wave analysis can improve entry timing, trend identification and risk management. Whether you are a beginner or an experienced trader, mastering this strategy can help you make more informed trading decisions.
What is Elliott Wave Theory?
Elliott Wave Theory is a form of technical analysis that studies recurring wave patterns in financial markets. According to Elliott, market prices move in predictable cycles caused by investor emotions such as fear and greed.
The theory suggests that trends move in a series of five waves in the direction of the main trend, followed by three corrective waves against the trend.
Basic Elliott Wave Structure:
| Wave Type | Direction | Description |
|---|---|---|
| Wave 1 | Trend | Initial move in the trend direction |
| Wave 2 | Correction | Partial retracement of Wave 1 |
| Wave 3 | Trend | Strongest and longest impulse wave |
| Wave 4 | Correction | Smaller pullback before final move |
| Wave 5 | Trend | Final push in the trend direction |
| Wave A | Correction | Market starts reversing |
| Wave B | Temporary Recovery | Short retracement |
| Wave C | Correction | Final corrective movement |
This structure repeats itself across different timeframes, making it useful for both short-term and long-term Forex traders.
Why Elliott Wave Analysis Works in Forex
The Forex market is heavily influenced by crowd psychology. Since Elliott Wave Theory focuses on human behavior patterns, it naturally aligns with currency market movements.
Key Benefits of Elliott Wave Forex Analysis:
- Helps identify trend reversals early.
- Improves trade entry and exit points.
- Works across multiple timeframes.
- Combines well with Fibonacci retracement.
- Enhances risk management strategies.
Unlike random trading methods, Elliott Wave analysis provides a structured framework for understanding price action.

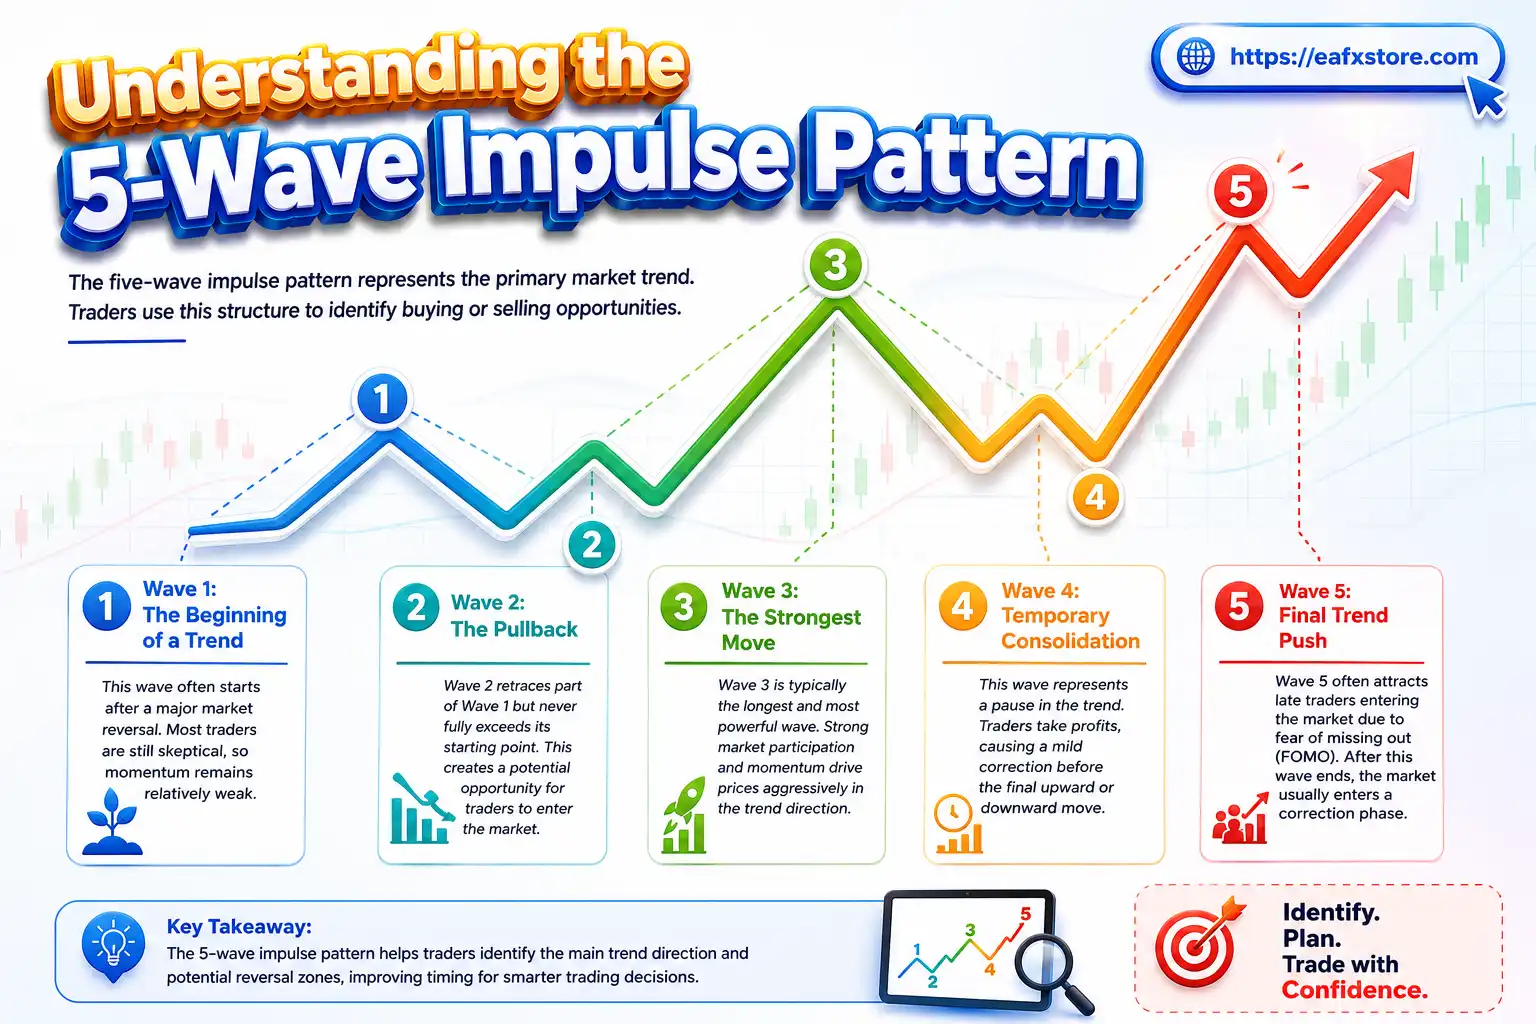
Understanding the 5-Wave Impulse Pattern
The five-wave impulse pattern represents the primary market trend. Traders use this structure to identify buying or selling opportunities.
Wave 1: The Beginning of a Trend
This wave often starts after a major market reversal. Most traders are still skeptical, so momentum remains relatively weak.
Wave 2: The Pullback
Wave 2 retraces part of Wave 1 but never fully exceeds its starting point. This creates a potential opportunity for traders to enter the market.
Wave 3: The Strongest Move
Wave 3 is typically the longest and most powerful wave. Strong market participation and momentum drive prices aggressively in the trend direction.
Wave 4: Temporary Consolidation
This wave represents a pause in the trend. Traders take profits, causing a mild correction before the final upward or downward move.
Wave 5: Final Trend Push
Wave 5 often attracts late traders entering the market due to fear of missing out (FOMO). After this wave ends, the market usually enters a correction phase.
How Corrective Waves Work
After the five-wave impulse sequence, the market enters a three-wave correction labeled A-B-C.
Characteristics of Corrective Waves:
| Corrective Wave | Market Behavior |
|---|---|
| Wave A | Initial reversal against trend |
| Wave B | False continuation of old trend |
| Wave C | Strong correction completing reversal |
Corrective waves are important because they help traders prepare for the next major trend cycle.
Using Fibonacci with Elliott Wave Analysis
Fibonacci retracement levels are commonly combined with Elliott Wave Theory to improve accuracy.
Popular Fibonacci Levels:
| Fibonacci Level | Common Usage |
|---|---|
| 23.6% | Weak retracement |
| 38.2% | Moderate pullback |
| 50% | Psychological level |
| 61.8% | Strong support/resistance |
| 78.6% | Deep retracement |
For example, Wave 2 often retraces 50% or 61.8% of Wave 1. Similarly, Wave 3 may extend to 161.8% of Wave 1.
Combining these tools allows traders to identify high-probability trading setups.
Best Timeframes for Elliott Wave Forex Trading
Elliott Wave analysis works on nearly every timeframe, but some are more reliable than others.
Recommended Timeframes:
| Trader Type | Best Timeframe |
|---|---|
| Scalpers | 5M – 15M |
| Day Traders | 1H – 4H |
| Swing Traders | Daily |
| Position Traders | Weekly |
Higher timeframes generally provide more accurate wave structures because market noise is reduced.
Common Mistakes Traders Make
Many beginners struggle with Elliott Wave analysis because wave counting can become subjective.
Mistakes to Avoid:
- Forcing wave patterns where none exist.
- Ignoring the overall trend.
- Trading without confirmation indicators.
- Overcomplicating wave counts.
- Neglecting stop-loss management.
The key to success is consistency and patience. Traders should combine Elliott Wave Theory with other technical indicators for confirmation.
Tips to Master Elliott Wave Forex Analysis
Learning Elliott Wave Theory takes time, but the following tips can accelerate your progress.
Practical Trading Tips:
- Start with higher timeframes first.
- Use Fibonacci retracement tools.
- Focus on Wave 3 opportunities.
- Practice wave counting daily.
- Keep a trading journal.
With enough practice, traders can improve pattern recognition and make more confident decisions.
Conclusion
Elliott Wave Forex Analysis is a powerful method for understanding market trends and predicting future price movements. By recognizing recurring wave structures, traders can improve their timing, reduce emotional trading, and identify profitable opportunities.
Although no strategy guarantees success, combining Elliott Wave Theory with Fibonacci analysis and sound risk management can significantly improve trading performance. Like any trading skill, mastery comes through continuous practice and market observation.
FAQs
❓ What is Elliott Wave Theory in Forex trading?
Elliott Wave Theory is a technical analysis method that identifies recurring market wave patterns to predict future price movements.
❓ Is Elliott Wave analysis accurate for Forex trading?
Yes, many traders use it successfully, especially when combined with Fibonacci levels and other technical indicators.
❓ Which wave is the strongest in Elliott Wave Theory?
Wave 3 is usually the strongest and longest wave because it reflects strong market momentum.
❓ Can beginners learn Elliott Wave trading?
Yes, but it requires practice, patience, and a solid understanding of market structure.
❓ What indicators work best with Elliott Wave analysis?
Fibonacci retracement, RSI, MACD, and moving averages are commonly used alongside Elliott Wave Theory.