You may have heard the term divergence before, and in this article, we will explain in detail what it is, how to trade with it, and its correlation with the market maker and liquidity.
Because divergence is one of the most important strategies that traders rely on, and if you learn divergence, you can achieve good profits or even know why you are experiencing losses in your trading.
Secrets of Divergence
1 – What is Divergence
It’s a difference in the movement between two indicators or pairs that have a positive correlation or even a negative correlation, Also, it can be between a pair and an indicator or between a pair and a currency index.
Divergence is also known as SMT to SMC / ICT traders.
For example, if you add the MACD and RSI indicators, you will notice that the movement of the two indicators is somewhat close, and both indicators form Highs and Lows. This is where SMT comes in. If the RSI indicator forms a Higher High, but the MACD cannot form a Higher High, this indicates divergence, or vice versa. It is possible that the MACD was able to form HH, but the RSI could not.
If this happens, this is an indication of divergence, meaning that there is a lack of synchronization between the movement of the indicators. This means that the indicator was unable to reach a higher peak than the previous peak, like the other indicator. This indicates that this peak is somewhat protected and the indicator will not be able to break it, and the price may fall as a result of this divergence.
The opposite is also true in the case of buying. If you see that the MACD was able to break the previous bottom and make a lower bottom than the previous bottom, but the RSI was unable to do so, then it is likely that this is a divergence signal and the RSI will push the prices higher. The break that occurred in the MACD is a false break and the RSI signal is the closest to the truth.
2 – Indicators Divergence
Divergence can also occur between an indicator and the price. For example, if the pair Forms a Higher High, but the indicator fails to Form a Higher High, this is also considered divergence.
Example 1
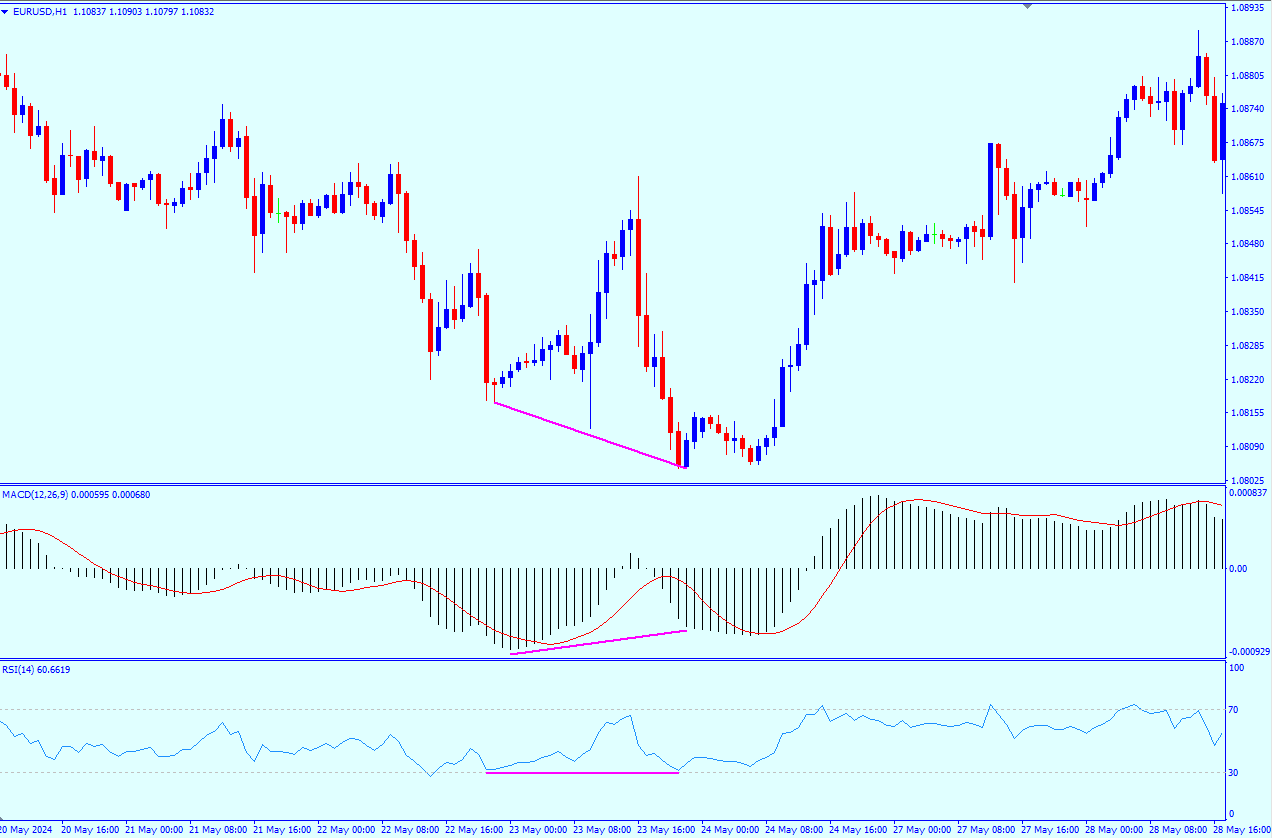
In this example, you will notice that after the price fell and broke the previous Low, the MACD and RSI could not keep up with this movement. They could not make a Lower Low like the price. This is a divergence signal and a signal of a reversal of this movement.
There is more than one divergence in this example. There is a divergence between the RSI and MACD indicators because they failed to form the same Highs and Lows. After all, the MACD made a Higher Low but the RSI made an Equal Low. However, this is not a strong signal that you can rely on to enter your trade. However, what supports the rise is the second signal that the price gave us, which is the break of the previous Low and the failure of the indicators to keep up with this break. It is possible then to enter a buy trade based on these two signals.
Example 2
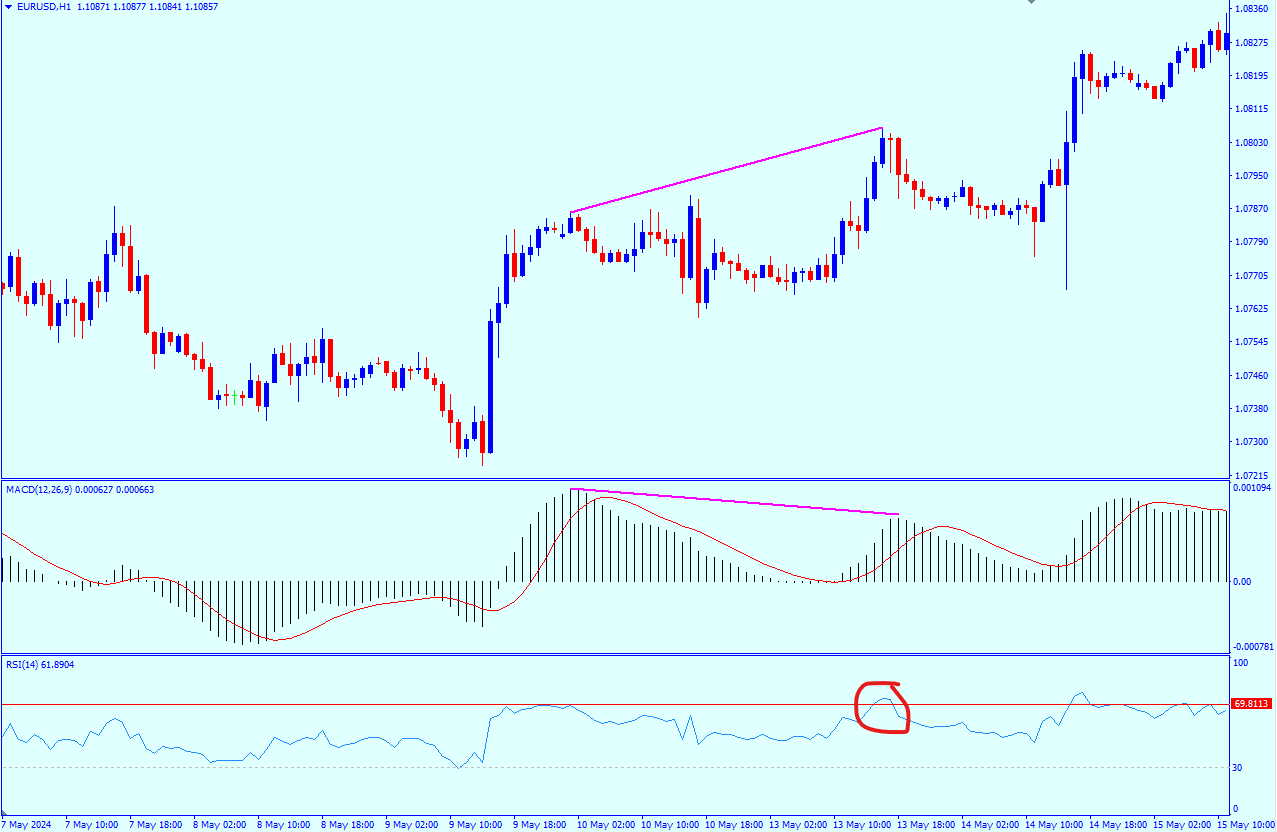
Another example of divergence between the indicators and the price movement, as you can see the pair broke the previous high and formed a Higher High, but the MACD could not keep up with this movement and formed a Lower High so far, this is considered a divergence, but there is another divergence between the indicators, which is that the RSI was able to break the previous high and formed a Higher High, and when this happens, this is considered a divergence between the RSI and the MACD. With such signals, it is a good opportunity for the price to rise because the divergence occurred in the indicators and the pair.
Example 3
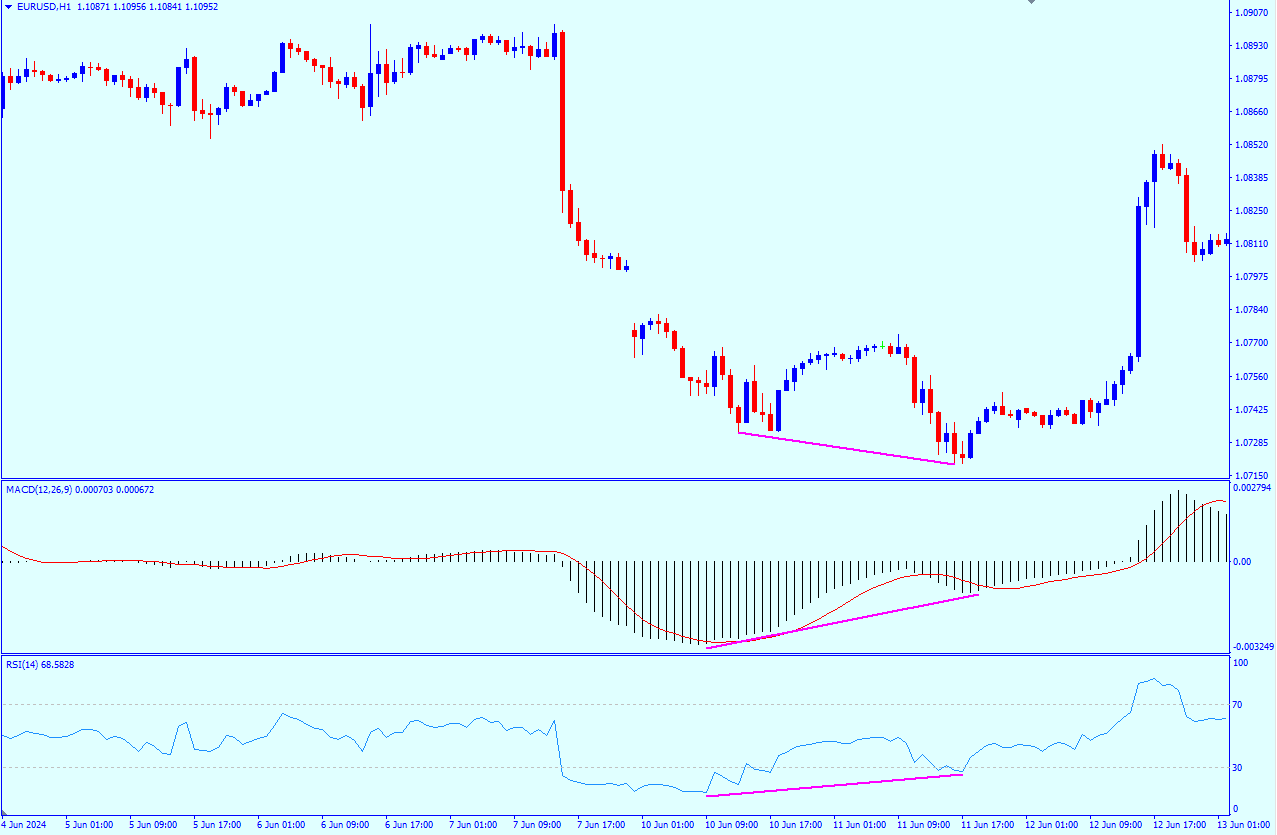
Another example that illustrates the importance of pair movement and not relying on indicators only. In this example, you will find the movement of the RSI and MACD indicators are the same, and the indicators have formed a Higher Low, but this movement is completely different from what is happening on the chart, as the EUR/USD has formed a Lower Low, and this is an indication that this break is not real and that there is a divergence,
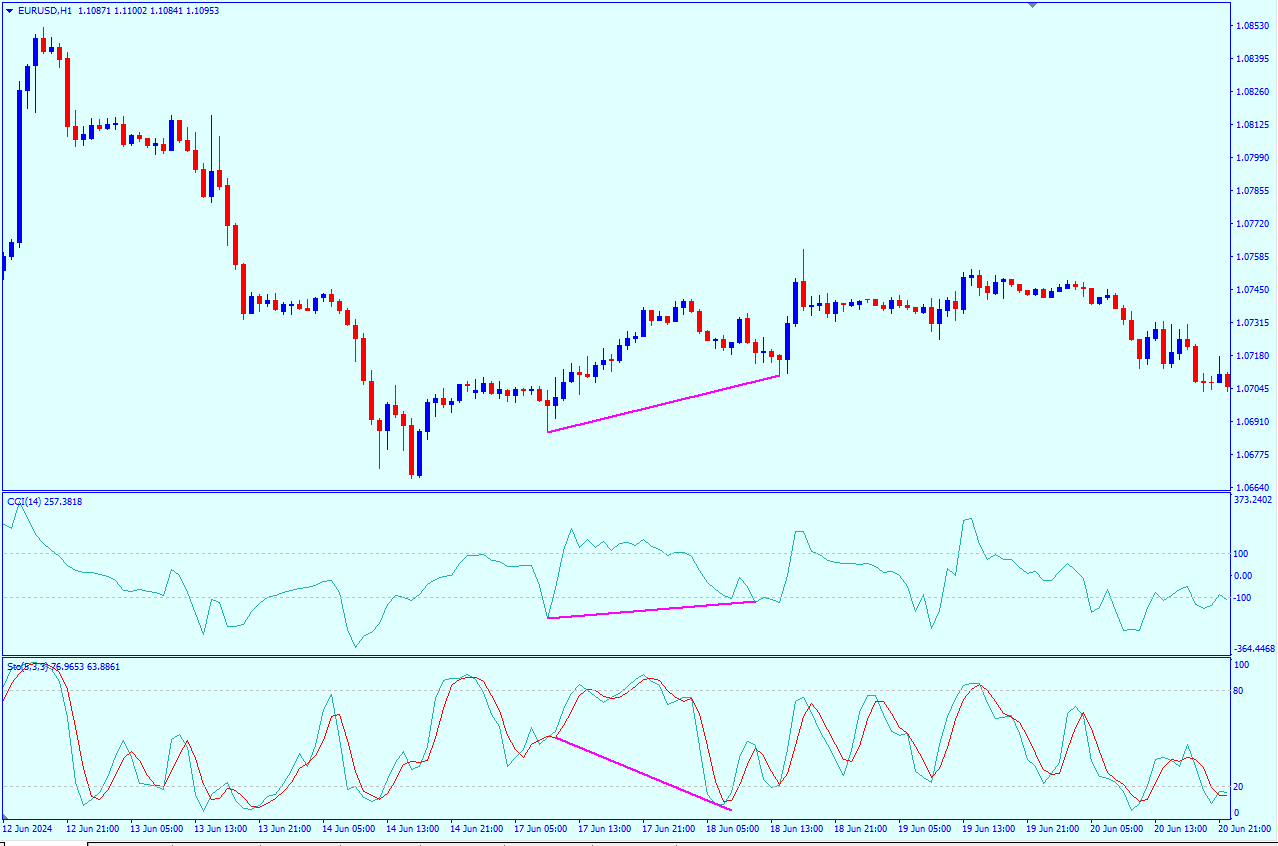
It is not necessary to use MACD and RSI, but these two indicators are the most popular among traders. You can use the CCI and Stochastic indicators.
In this example, a divergence occurred in the stochastic only because the price movement was similar to the movement of the CCI indicator, as the price or the indicator could not break the Low and form a Lower Low, but the stochastic was able to break this low, and this is considered a false signal, and the indicator may rise, therefore, the price will also rise, The signal is not very strong because these two indicators are not very accurate in their signals so MACD and RSI are the most common in determining divergence.
3 – Pairs SMT
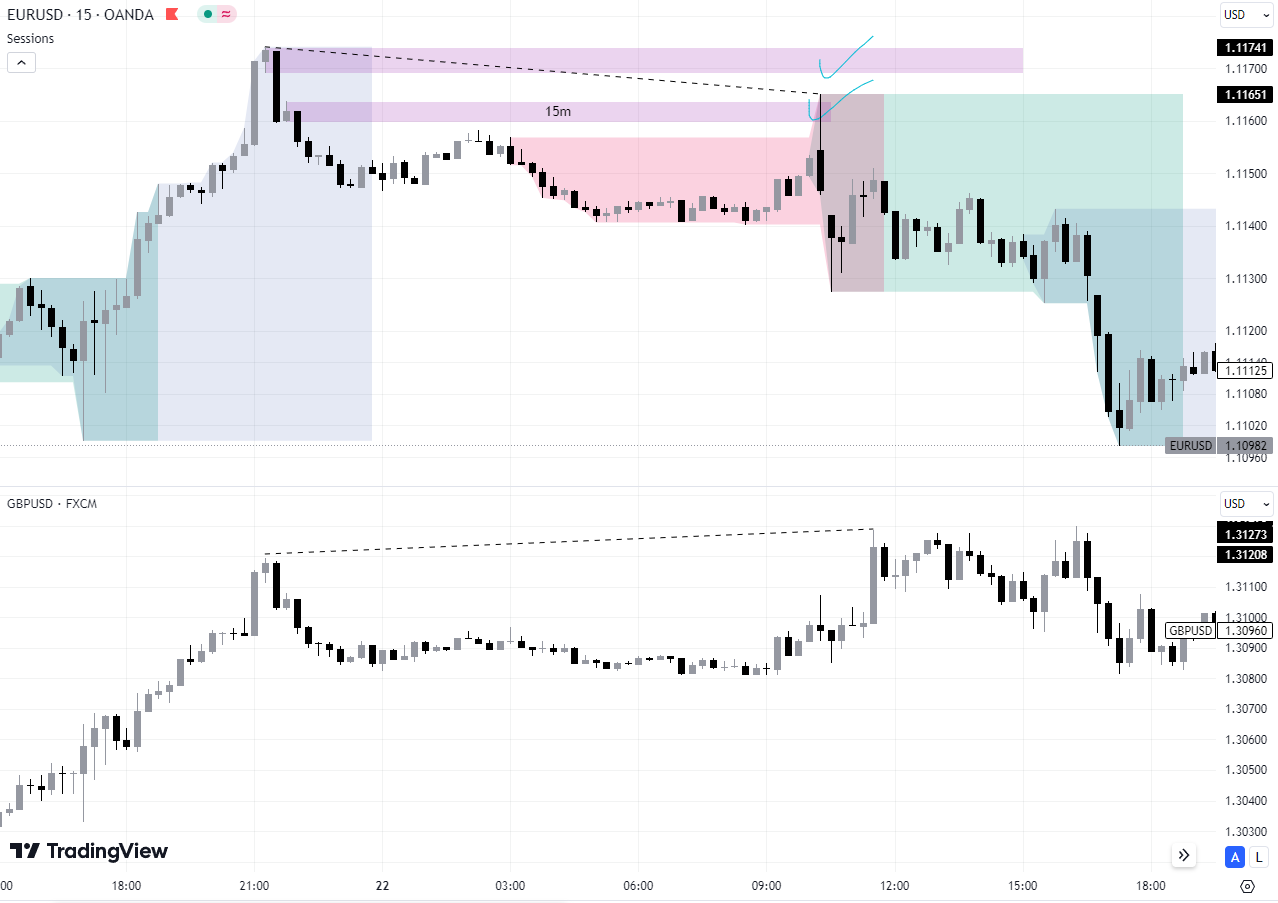
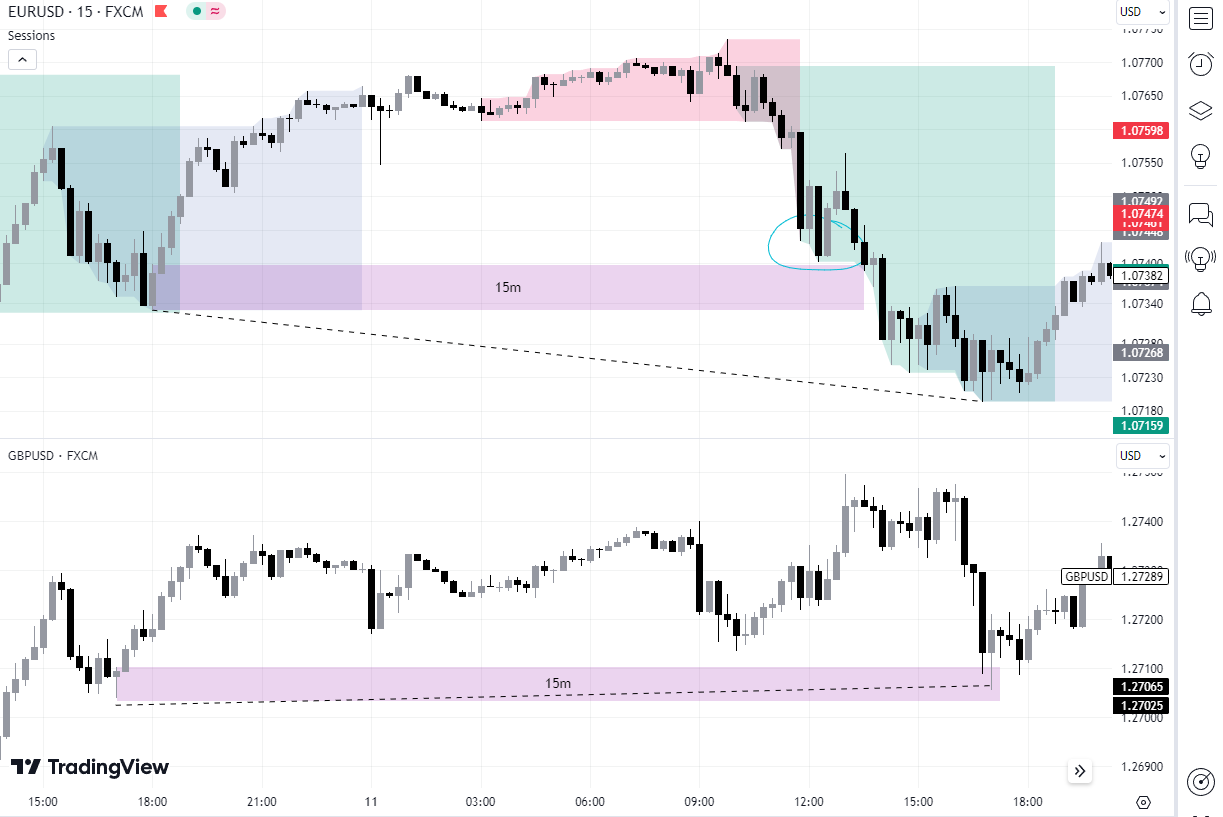
There is also a divergence between the pairs. For example, if you add the EUR/USD pair and the GBP/USD, you will notice that the 2 pairs are similar in movement. In the case that the EUR/USD Forms a Higher High, but the GBP/USD is not able to form a Higher High too, in this case, this is considered an SMT and this break is likely not real.
Example 1
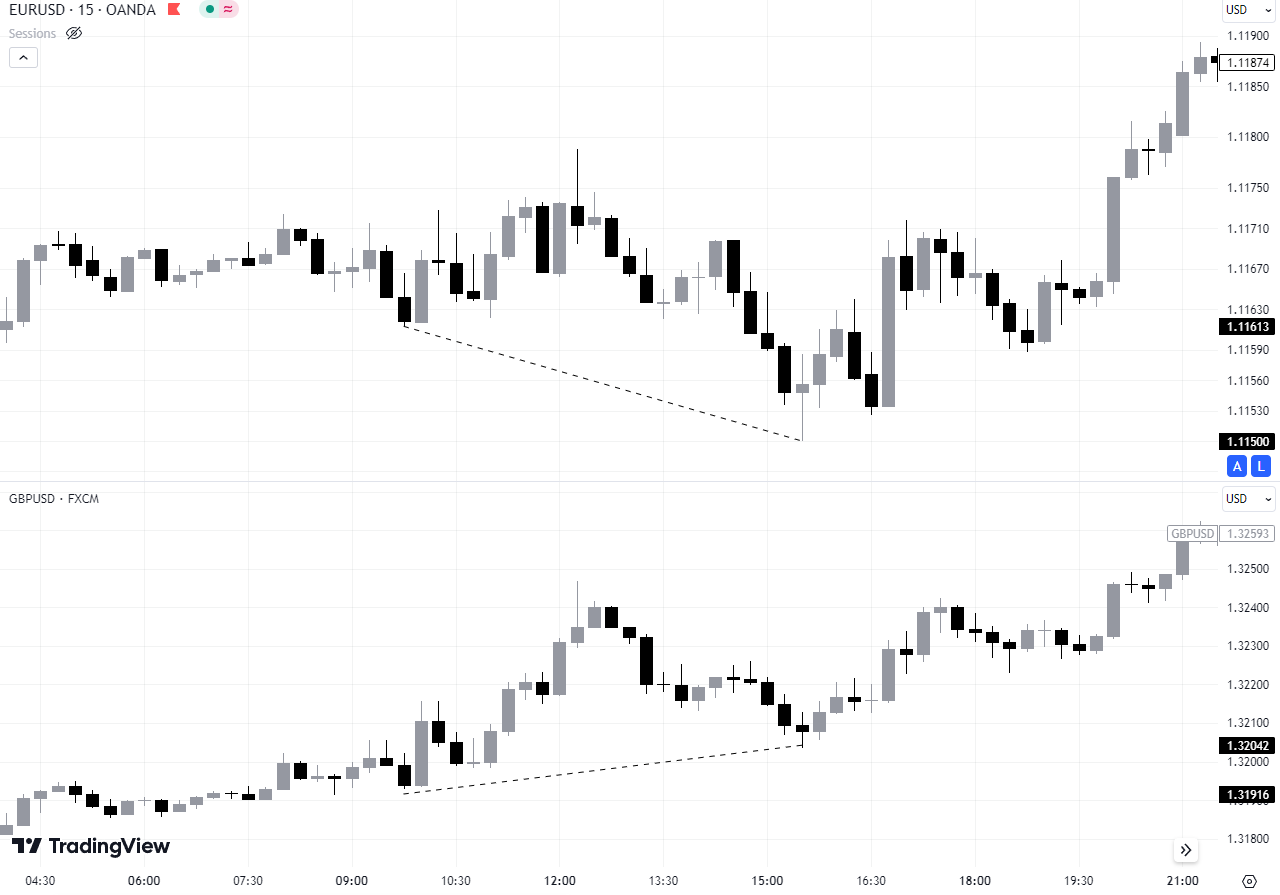
In this example, the EUR/USD and GBP/USD pairs were added because they are similar pairs in movement. The EUR/USD broke the previous bottom and formed a Lower Low, but the GBP/USD could not break the previous bottom, and this is considered an SMT signal.
Example 2
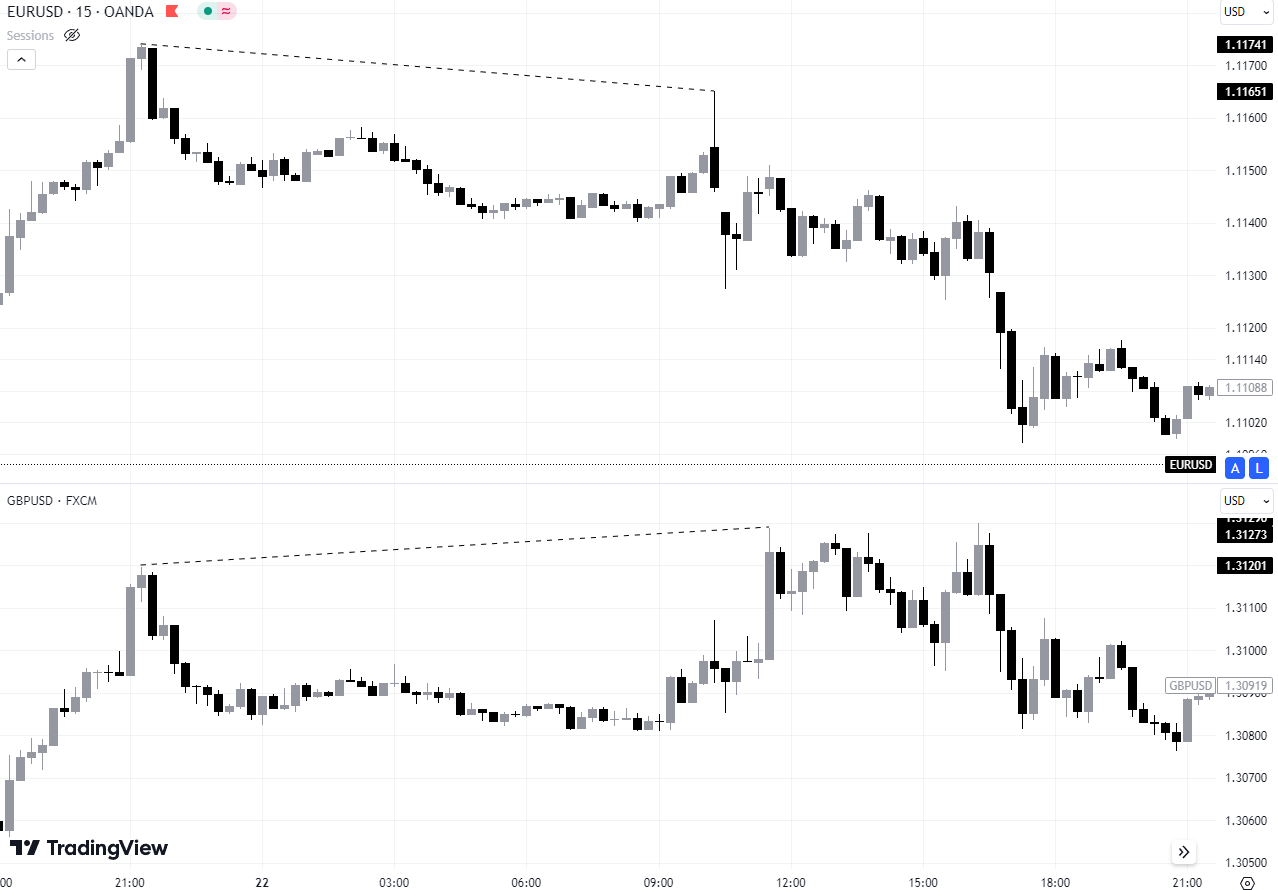
In this example, the EUR/USD broke the High, but the GBP/USD could not break the previous High. This indicates that the top that the GBP/USD could not break is protected, and this break on the EUR/USD may be a false break.
You may notice that the movement of the Pairs is not completely similar at the time of SMT, and this is very normal because before SMT there is one pair that is faster than the other so that it can break the high or low.
You can look for divergence in any 2 pairs that have a positive correlation or even a negative correlation. It is not necessary to trade on the EUR/USD and the GBP/USD. You can look for divergence in the currency index.
For example, the dollar index (DXY) has a negative correlation between the EUR/USD and the GBP/USD. When you combine the pair and the index, you will look for similar movements because the index moves in the opposite direction to the pair. It is natural that if the high is broken in the euro dollar, the dollar index will break the low, but if it fails to break the low, this is the divergence we are looking for.
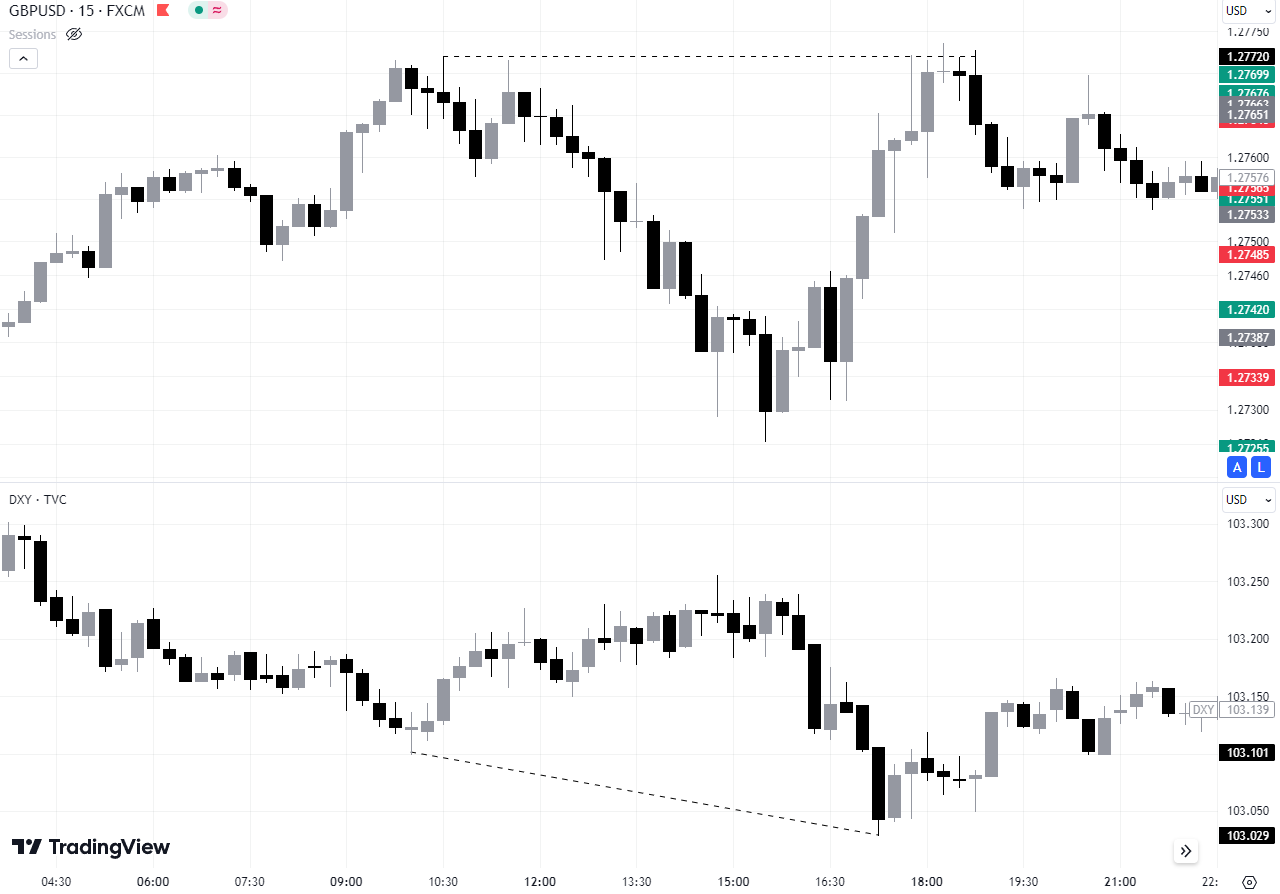
In this example, you will notice the dollar index falling and breaking the previous low and Forming a Lower Low, but the GBP/ISD could not break the High and the candle closed below the previous top, and this is considered a divergence signal.
When you combine a pair with a currency index and divergence occurs on the pair or currency, you will enter your trade on the pair, not the index because as long as a signal occurs, the pair will reverse as long as it is a correct signal and not a false one.
What is the concept of Divergence?
The concept of divergence is a difference in the movement of two pairs or indicators. This manipulation comes from the market maker to make traders lose. The break that occurs in the indicator or pair is considered a false break to make traders who will buy if the pair rises and breaks a resistance level enter this trade and then the price reverses and falls making them lose.
Divergence is a factor closely related to liquidity. Liquidity is the Number 1 priority of the market maker. They move prices so that they can collect the largest possible liquidity to make traders lose and then prices move in its direction.
Divergence is an important tool that helps you identify the traps that the market maker sets for you. With this tool, you can avoid falling into losses and entering early trades. You will also be able to identify the false breakout areas that the market maker deceives traders with.
4 – How to trade with Divergence
Trading with divergence is easy and simple, but like any strategy you have just learned, you must test it first on a demo account to get used to it and know what its strengths and weaknesses are. With time, you will be able to identify divergence skillfully.
Entry conditions
One of the main reasons for entering a trade is a break in one pair and another pair that has not broken. When a break occurs at the Low or the High, this is a sign that this is a false break.
Another very important thing is that when the break occurs, you will choose the pair that respected the High or the Low, in other words, the pair that did not break the High or Low, because the pair that broke the top or bottom is likely to be traded by market makers in order to make traders lose, so it is not wise to trade on this pair.
The pair that did not break the top or bottom showed a good reaction to these levels and it is likely that this level is strong and will not be able to break it and the opposite is true for the other pair because it broke the top or bottom, this indicates the weakness of this level and if you wanted to enter a trade on this pair it will likely continue to reverse.
In this example, it is clear that the Euro Dollar broke the top and the GBP Dollar could not keep up with the movement and fell. In this case, if you decide to enter a sell on the EUR/USD, the price will make you lose all these pips, and the exact opposite is true if you decide to enter a sell on the GBP/USD.
Because the GBP/USD is the one that respected the high and did not break it, this indicates that this high is protected and the price will not be able to break it, at least at present.
Entry Trigger
When the break occurs, you must enter the trade on the pair that has not yet broken the level, as we mentioned, and then you will determine the supply and demand zones in order to know what factors will make the pair rebound.
For example, you can determine trend lines, order block Zones, support and resistance, etc. All of these are suitable methods that you can determine to enter with divergence. Whatever your strategy is, divergence is likely to support it.
You can also determine these levels before the divergence occurs in order to be one step ahead of the market. If the divergence occurs, you will be ready to enter the trade immediately.
In this example, I have defined two order blocks when the divergence occurred and both areas were correct but the price showed a good reaction in the first order block and you will most likely notice that the first order block is the one that the price respects and bounces from.
When it bounced from this area and closed a 15-minute candle below it, it was a good signal to enter the trade.
Please note that in the event of strong news, it is preferable not to trade at such times because the news does not respect analysis methods or even divergence, so it is preferable not to enter any trade 30 minutes before the news.
Take profit and stop loss
The stop loss is somewhat variable as it depends on the area from which the trade was entered and there is no fixed number of pips for the stop loss. In this example, the stop loss was above the order block zone, but in this case, the trade was not entered directly and the signal was the factor to enter the trade Then, the the stop loss will be above the wick of the bearish candle (above the ob by 1.5 pip)
As for take profit, you can set the take profit ratio to 1:2 if you are trading on the 15-minute frame. This is a good ratio, But if you are trading on larger time frames, you can increase this percentage compared to the stop loss level, of course.
Timeframes
There is no specific time frame for divergence. All time frames are good and you can get a good signal from them to enter, but knowing the time frame used may help you determine your take profit, whether it is 1:2, 1:3, or 1:4. The longer the time frame, the stronger the opportunity. If the opportunity is strong, you can increase the pips you will get.
There are also good opportunities that you may find in the 15-minute time frame, where you may set a take profit of 1:4.
The Strengths and Weaknesses of Divergence
Like any trading strategy or method, it has advantages and disadvantages. Of course, divergence will not make you win all the trades. You may lose many trades in the beginning because you may determine the divergence in the wrong way or determine an area before breaking the high or low.
Or you may even lose many trades after you master divergence because no strategy always wins, right? Examples that you may encounter in determining divergence and may make you lose are:
Rush to enter a trade
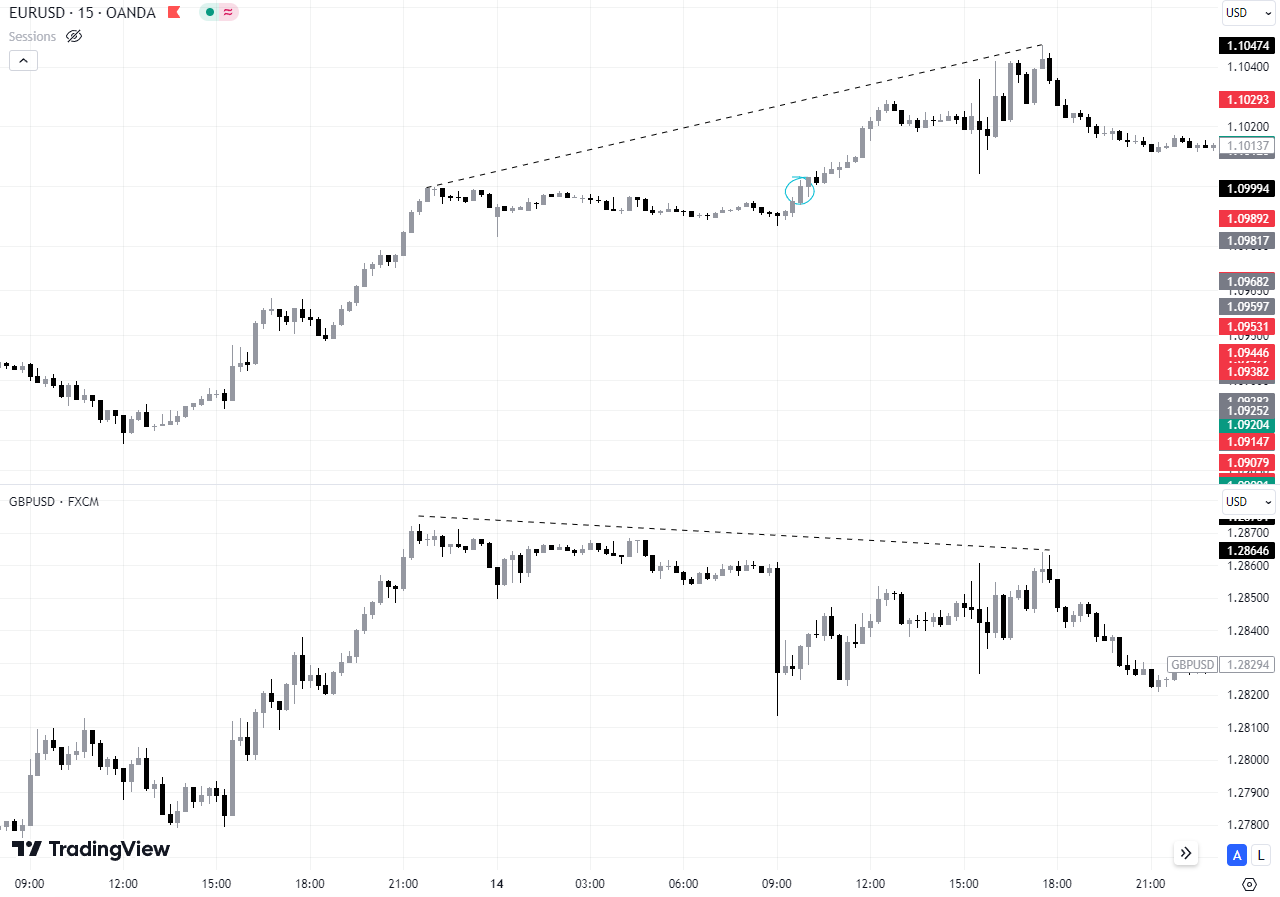
You may rush into a trade before you give yourself a chance to understand what is happening. In this example, you will see that there was a divergence that occurred and the price rose Normally. But let us go back a little in time and see what happened before this Low was broken.
The price has reached a demand zone and you may think that this zone is good, but since the price has reached this zone in the EUR/USD pair, you will decide to enter the GBP/USD pair, but this decision is a bit hasty because the divergence has not yet been completed, so you must see the important Lows and Highs.
The important bottoms and tops are the ones that give a big movement to the price in the event of divergence, and when this false break occurs, then you will seize all these pips, early entry is also one of the traps that the market maker sets for traders so that they do not exploit the divergence.
Overoptimism
If you are trading on a small frame such as 15 minutes, it is natural that the take profit will also be small, such as 20 pips or even 40 pips. It is unreasonable to set a take profit of more than 100 pips only because there is divergence.
Excessive optimism may make you lose the trade after you were in good profit, as each time frame has its own Risk to reward ratio, but If you want to set a large take profit, you can trade on the hourly or four-hour frame.
Can I rely on Divergence completely?
The answer is yes and no, First, you should use divergence as a tool to help you along with your strategy. In this case, you will use divergence to the best advantage and it will give you additional confirmation of important entry and exit areas.
But this does not prevent you from trading with divergence alone. There are traders who use divergence alone and do not add anything to it. In fact, divergence is so good that you do not need anything with it, but not in the beginning. When you start using divergence, you should use it as an auxiliary tool only.
You can also combine divergence with different indicators such as the 200 moving average or more moving averages and take advantage of the Cross that occurs. When a cross occurs between the moving averages You can look for divergence at this time and it could be a good opportunity to enter.
Conclusion
Divergence is one of the most important tools that can help you in trading. When you know divergence and how the market maker manipulates prices to make traders lose, you will be able to avoid such manipulations and you can also make profits when the market maker joins the market.
There are different types of divergence, and in order to master them well, you must first practice them on a demo account in order to understand them well and get used to them, so that you do not rush into entering the trade before the divergence occurs and the break is confirmed. Patience is one of the most important factors in mastering any strategy.

