for Accurate Buy and Sell Signals 2")
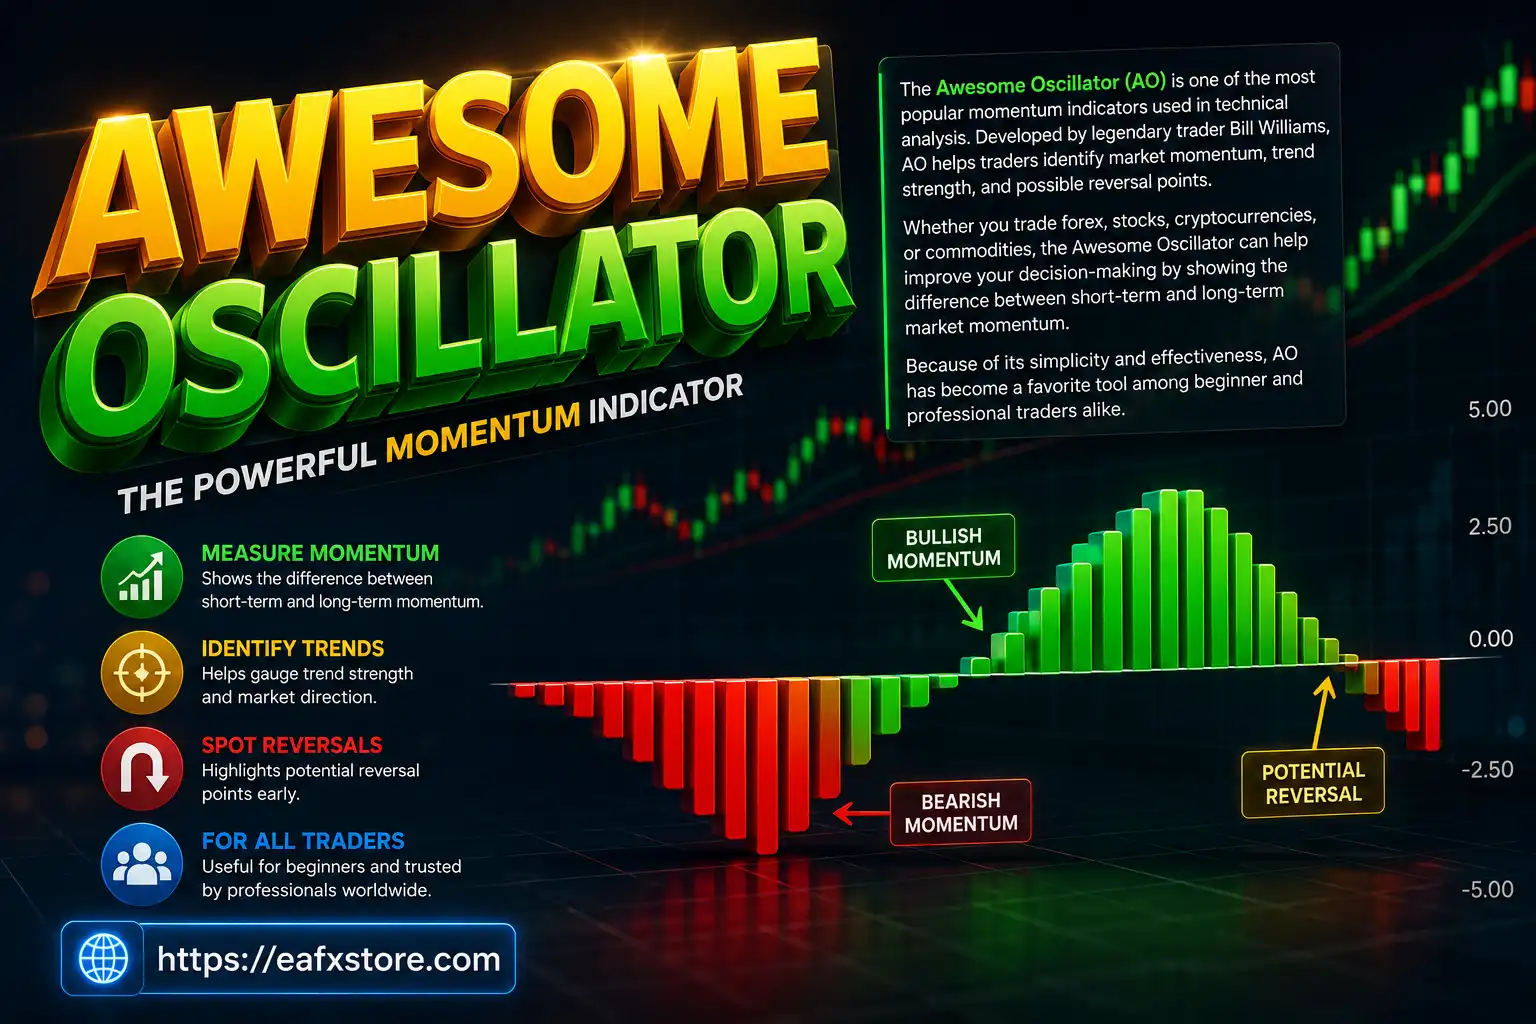
The Awesome Oscillator (AO) is one of the most popular momentum indicators used in technical analysis. Designed by legendary trader Bill Williams, AO helps traders identify market momentum, trend direction, and potential buy or sell opportunities.
Whether you trade forex, stocks, crypto, or commodities, the Awesome Oscillator can improve your ability to spot reversals and trend continuation patterns. The indicator is easy to read, beginner-friendly, and highly effective when combined with other trading tools.
What is the Awesome Oscillator?
The Awesome Oscillator is a histogram-based technical indicator that measures market momentum. It compares recent market momentum with longer-term momentum to determine whether bullish or bearish pressure is increasing.
The AO is calculated using the difference between:
- A 34-period Simple Moving Average (SMA)
- A 5-period Simple Moving Average (SMA)
Both moving averages are based on the median price rather than the closing price.
The indicator appears as a histogram below the chart:
- Green bars indicate increasing bullish momentum
- Red bars indicate increasing bearish momentum
- Bars above zero suggest upward momentum
- Bars below zero suggest downward momentum
Because AO focuses on momentum shifts, traders use it to confirm trends and identify possible reversals before they fully develop.
 for Accurate Buy and Sell Signals 3")
How the Awesome Oscillator Works
The Awesome Oscillator tracks the strength of market momentum by comparing short-term and long-term price movement.
When short-term momentum becomes stronger than long-term momentum, the histogram moves upward. When short-term momentum weakens, the histogram declines.
Here is a simple interpretation table:
| AO Position | Market Signal | Interpretation |
|---|---|---|
| Above Zero | Bullish Momentum | Buyers are gaining strength |
| Below Zero | Bearish Momentum | Sellers are dominating |
| Green Bars | Increasing Momentum | Trend strength is growing |
| Red Bars | Weakening Momentum | Trend may reverse |
The AO does not predict the market perfectly, but it helps traders recognize momentum changes earlier than many traditional indicators.
Why Traders Use AO for Buy and Sell Signals
Traders prefer the Awesome Oscillator because it simplifies momentum analysis. Instead of manually calculating trend strength, the indicator visually highlights changes in market direction.
Some major benefits include:
- Easy to understand for beginners
- Works on multiple markets and timeframes
- Helps confirm trend reversals
- Identifies momentum shifts quickly
- Pairs well with other indicators
The indicator is especially useful for swing traders and day traders looking for early entry and exit opportunities.
However, like any technical indicator, AO should not be used alone. Combining it with price action, support and resistance, or moving averages improves accuracy.
 for Accurate Buy and Sell Signals 4")
Best Awesome Oscillator Buy Signals
The Awesome Oscillator offers several reliable bullish trading setups. Understanding these patterns can help traders enter trades with better timing.
🎯 Saucer Signal
The saucer signal occurs when the histogram remains above the zero line and changes from red bars to green bars after a temporary pullback.
This pattern suggests that bullish momentum is returning.
🎯 How to Identify a Bullish Saucer
- AO bars stay above zero
- Two consecutive red bars appear
- A green bar forms afterward
This setup often signals trend continuation in an uptrend.
🎯 Zero Line Crossover
A bullish zero line crossover happens when the AO moves from below zero to above zero.
This indicates that short-term momentum has become stronger than long-term momentum.
🎯 Buy Signal Conditions
- AO crosses above the zero line
- Market structure remains bullish
- Volume or trend confirmation supports the move
Many traders use this as an early trend reversal signal.
🎯 Twin Peaks Signal
The twin peaks setup is one of the strongest AO reversal patterns.
A bullish twin peaks signal forms when:
- Both peaks stay below zero
- The second peak is higher than the first
- The histogram turns green after the second peak
This pattern suggests bearish momentum is weakening and buyers may take control.
 for Accurate Buy and Sell Signals 5")
Best Awesome Oscillator Sell Signals
The Awesome Oscillator also provides effective bearish trading signals.
🎯 Bearish Saucer Signal
This pattern forms below the zero line when momentum temporarily strengthens before continuing downward.
Conditions include:
- AO remains below zero
- Two green bars appear
- A red bar follows
This setup indicates sellers are regaining momentum.
🎯 Bearish Zero Line Crossover
A bearish crossover happens when the histogram drops below zero.
This suggests increasing bearish pressure and possible trend reversal.
🎯 Bearish Twin Peaks
This pattern appears above the zero line.
Conditions include:
- Two peaks above zero
- The second peak is lower than the first
- A red histogram bar appears after the second peak
The signal indicates weakening bullish momentum and possible downward movement.
 for Accurate Buy and Sell Signals 6")
Combining AO With Other Indicators
Although the Awesome Oscillator is powerful, combining it with other indicators increases trading accuracy.
Here are some effective combinations:
| Indicator | Purpose | Benefit |
|---|---|---|
| Moving Averages | Trend Confirmation | Reduces false signals |
| RSI | Overbought/Oversold Analysis | Improves entry timing |
| MACD | Momentum Confirmation | Strengthens trend analysis |
| Support & Resistance | Price Reaction Zones | Better risk management |
| Volume Indicators | Market Participation | Confirms breakout strength |
For example, if AO gives a bullish crossover while RSI exits oversold territory and price breaks resistance, the probability of a successful trade increases significantly.
Professional traders rarely rely on a single indicator. Multiple confirmations reduce emotional trading and improve consistency.
Common Mistakes Traders Should Avoid
Many beginners misuse the Awesome Oscillator and generate poor results. Avoiding these mistakes can improve your trading performance.
- Using AO Alone: The AO works best as a confirmation tool rather than a standalone strategy. Always combine it with market structure and price action.
- Ignoring the Trend: Taking buy signals in a strong downtrend can be risky. Always analyze the higher timeframe trend before entering trades.
- Overtrading Small Signals: Not every histogram color change is a valid trading opportunity. Focus on strong setups with confirmation.
- Poor Risk Management: Even the best signals fail sometimes. Use stop-loss orders and proper position sizing to protect your capital.
- Trading During Low Volatility: AO performs better in trending markets. Sideways conditions can create false signals and market noise.
Conclusion
The Awesome Oscillator is a valuable technical indicator for identifying momentum shifts and spotting potential buy and sell opportunities. By understanding patterns like the saucer setup, zero line crossover, and twin peaks formation, traders can improve their market timing and decision-making.
However, no indicator guarantees success. The best approach is to combine AO with other technical analysis tools, follow proper risk management and trade with discipline.
Whether you are a beginner or experienced trader, mastering the Awesome Oscillator can help you better understand market momentum and develop a more effective trading strategy.
FAQs
❓ What is the Awesome Oscillator used for?
The Awesome Oscillator is used to measure market momentum and identify potential buy or sell opportunities based on momentum shifts.
❓ Is the Awesome Oscillator good for beginners?
Yes. The indicator is beginner-friendly because it uses a simple histogram format that is easy to interpret.
❓ Can I use AO for crypto trading?
Yes. The Awesome Oscillator works well in crypto, forex, stocks, and commodity markets.
❓ Which timeframe works best for AO?
The AO can work on multiple timeframes, but many traders prefer the 1-hour, 4-hour, and daily charts for stronger signals.
❓ Should I use AO alone for trading decisions?
No. It is best to combine AO with other indicators, price action analysis, and risk management techniques for better accuracy.