
Volume is often called the fuel behind price. A breakout on heavy volume tends to carry more conviction than one on light volume, and Volume Profile levels such as the Point of Control are only as good as the volume data behind them. But in Forex, there is a catch: most traders never see real volume at all.
This article explains what real volume is, why it is missing from most Forex charts, and how you can still access it when your analysis needs it.
What is Real Volume?
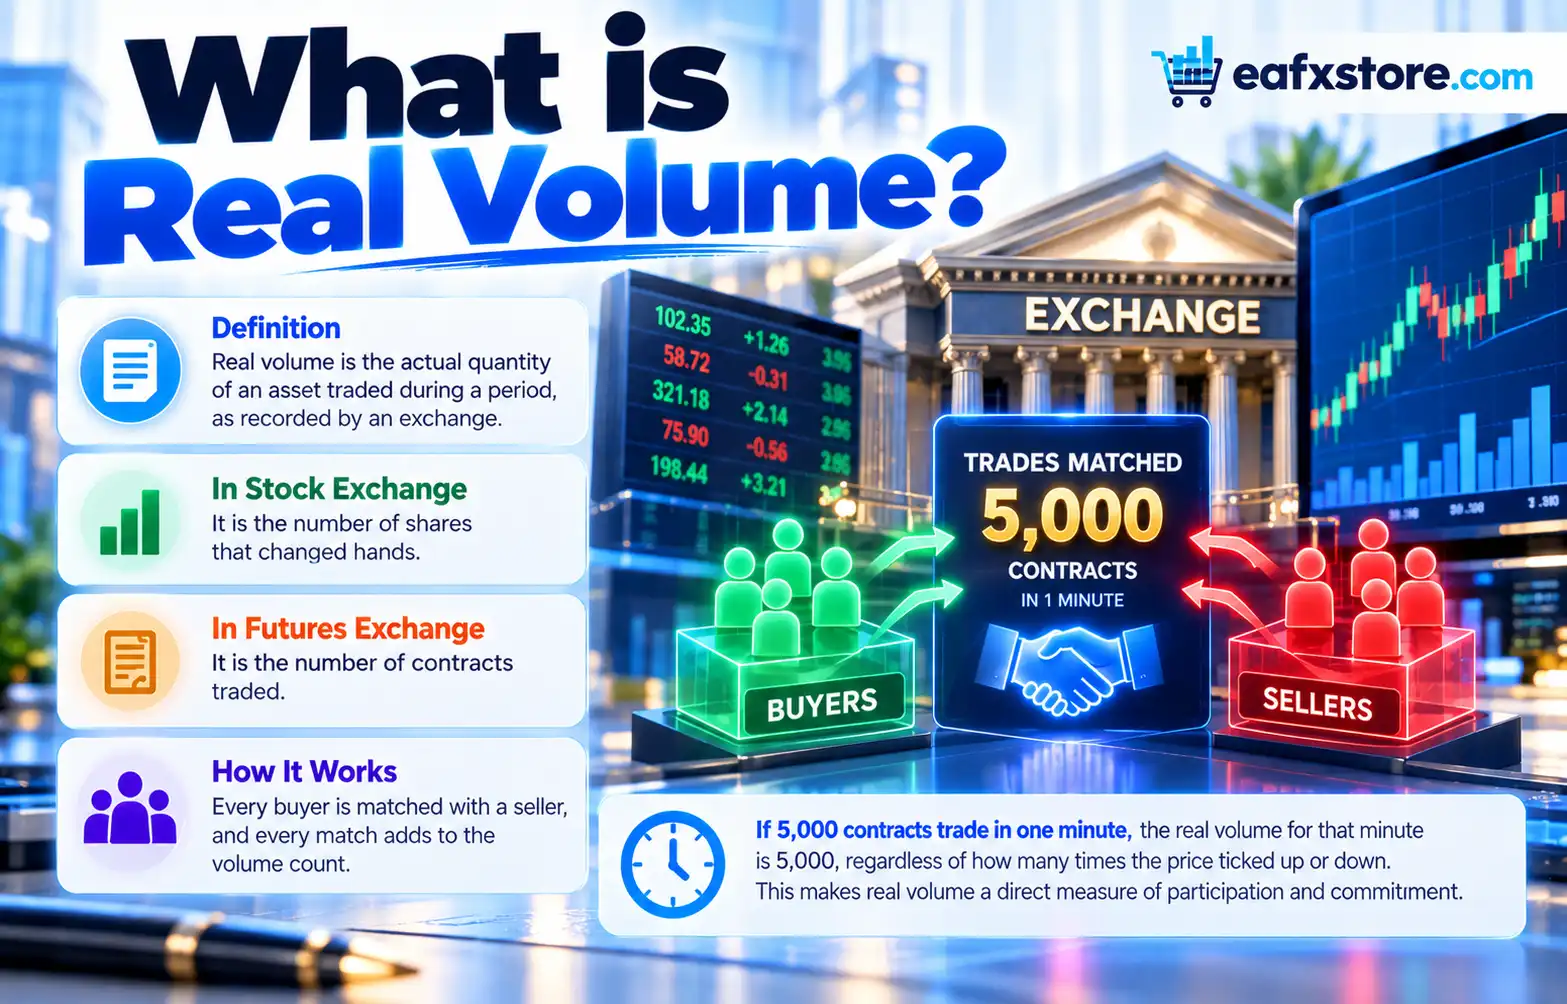
Real volume is the actual quantity of an asset traded during a period, as recorded by an exchange. On a stock exchange it is the number of shares that changed hands. On a futures exchange it is the number of contracts traded. Every buyer is matched with a seller, and every match adds to the volume count.
If 5,000 contracts trade in one minute, the real volume for that minute is 5,000, regardless of how many times the price ticked up or down. This makes real volume a direct measure of participation and commitment.
On MetaTrader 5, real volume appears as a separate data option, often labelled Real Volume or simply REAL, alongside tick volume. Many Volume Profile indicators include a setting to choose between the two.
Why Most Forex Charts Do Not Show Real Volume
The spot currency market is decentralised. There is no single exchange where all EUR/USD trades take place. Instead, currencies are traded over the counter between banks, institutions, liquidity providers and brokers across the world.
Because no central venue records every trade, nobody has the complete total. A retail broker only sees the trades that pass through its own systems, which is a tiny fraction of the global market. If you trade CFDs, your broker’s platform simply has no real volume to display for currency pairs, so the REAL option is usually empty or unavailable.
That is why most Forex traders rely on tick volume, which counts price changes rather than traded size.
Where Forex Traders Can Find Real Volume
The good news is that real volume for major currencies does exist, just not in the spot market.
Currency futures
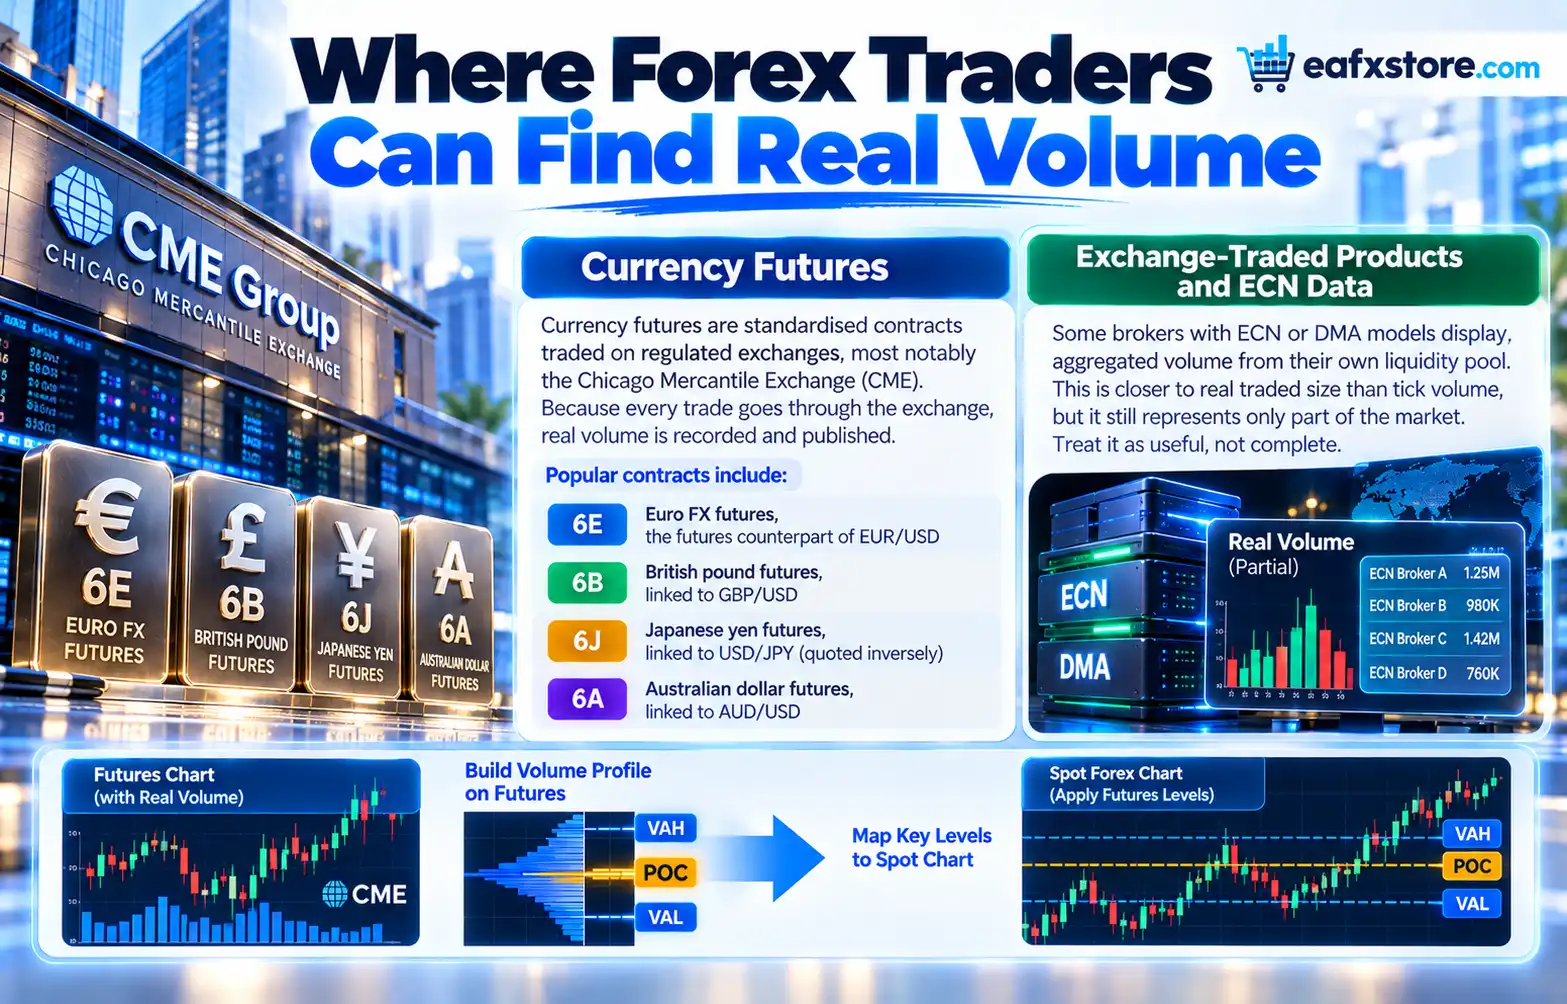
Currency futures are standardised contracts traded on regulated exchanges, most notably the Chicago Mercantile Exchange (CME). Because every trade goes through the exchange, real volume is recorded and published. Popular contracts include:
- 6E – Euro FX futures, the futures counterpart of EUR/USD
- 6B – British pound futures, linked to GBP/USD
- 6J – Japanese yen futures, linked to USD/JPY (quoted inversely)
- 6A – Australian dollar futures, linked to AUD/USD
Many traders build their Volume Profile on the futures contract, identify the Point of Control, Value Area High and Value Area Low, and then map those levels onto their spot or CFD chart.
Exchange-traded products and ECN data
Some brokers with ECN or DMA models display aggregated volume from their own liquidity pool. This is closer to real traded size than tick volume, but it still represents only part of the market. Treat it as useful, not complete.
Real Volume vs Tick Volume
| Feature | Real volume | Tick volume |
| What it counts | Contracts or units traded | Number of price changes |
| Source | Central exchange | Broker’s price feed |
| Available on Forex CFDs | Rarely | Almost always |
| Consistent across platforms | Yes, for the same contract | No, varies by broker |
| Best for | Precise volume analysis | Estimating activity |
Research and practical experience suggest the two measures often move in the same direction: busy periods show more ticks and more traded contracts. However, real volume captures the size of trades, while tick volume cannot tell a large institutional order from a small retail one.
How to Use Real Volume in Your Analysis
- Confirm breakouts. A move above the VAH on rising real volume in the futures market suggests genuine participation.
- Validate Volume Profile levels. Compare the POC on the futures profile with the POC on your CFD chart. When they align, the level is more reliable.
- Spot exhaustion. A strong trend that continues on falling real volume can signal weakening commitment.
- Watch session behaviour. Real volume in currency futures typically rises during the London and New York sessions, which helps you time entries.
Limitations to Keep in Mind
Futures prices are not identical to spot prices. They include an interest-rate differential, so levels may be offset by a few pips and must be adjusted.
Futures volume also shows only exchange activity, not the entire interbank market. Finally, real-time futures data may require a paid subscription from your data provider.
Frequently Asked Questions
What does REAL mean in a volume indicator?
It refers to real volume, the actual number of contracts or units traded, as opposed to tick volume.
Why is real volume zero on my Forex chart?
Because spot Forex and CFDs are traded over the counter, your broker has no exchange volume to display.
Is real volume better than tick volume?
Real volume is more precise, but tick volume is widely available and usually tracks the same activity patterns.
Where can I see real volume for EUR/USD?
Use the CME Euro FX futures contract (6E), available on platforms that provide futures data.
Conclusion
Real volume is the most accurate measure of market participation, but the decentralised structure of Forex keeps it off most retail charts. By understanding the difference between real and tick volume, and by using currency futures when you need exchange data, you can apply Volume Profile with more confidence. Continue with our guide to tick volume in Forex to learn how to make the most of the data you already have.
Risk warning: Trading Forex, futures and CFDs carries a high level of risk and may not be suitable for all investors. This article is for educational purposes only and is not investment advice.