
If you could mark only one level on your chart from Volume Profile, it should be the Point of Control. The POC shows the price where the market did the most business during a given period. It is the level buyers and sellers agreed on most often, which is why many traders call it the market’s fairest price.
In this guide you will learn what the Point of Control is, how it is calculated, why price reacts to it, and how to build practical trading setups around it.
What is the Point of Control?
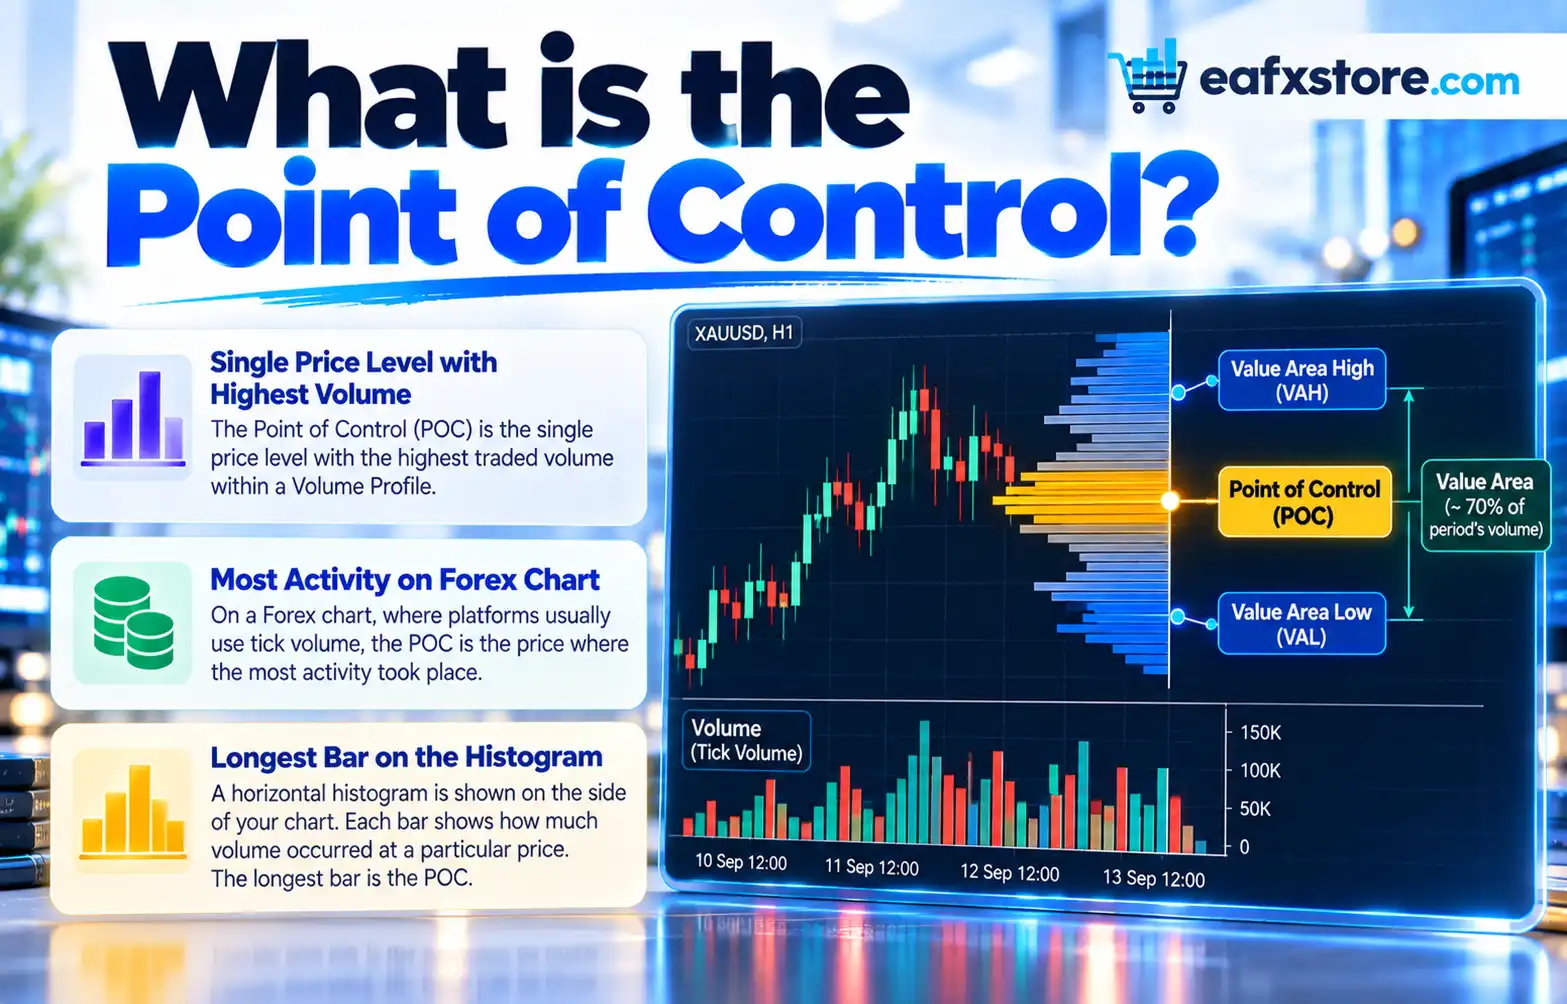
The Point of Control (POC) is the single price level with the highest traded volume within a Volume Profile. On a Forex chart, where platforms usually use tick volume, it is the price where the most activity took place.
Picture a horizontal histogram on the side of your chart. Each bar shows how much volume occurred at a particular price. The longest bar is the POC. Around it, you will find the Value Area, the zone that contains roughly 70% of the period’s volume, bounded by the Value Area High (VAH) and the Value Area Low (VAL).
Types of POC
- Session POC: calculated for a single trading day or session. Popular with intraday traders.
- Weekly or monthly POC: built from a longer period and more significant for swing traders.
- Composite POC: calculated across a custom range, for example the last three months, to find long-term value.
- Developing POC: the POC of the current session as it forms in real time. Its movement shows where value is migrating.
- Naked (virgin) POC: a previous session’s POC that price has not revisited since. Many traders treat naked POCs as targets, because price often returns to test them.
Why Price Reacts to the POC
The POC represents acceptance. At that price, both sides were willing to trade heavily, so it reflects a temporary agreement on value. This creates two common behaviours.
The magnet effect. When price moves away from the POC without strong conviction, it often drifts back towards it. In a range-bound or neutral market, price can rotate around the POC for hours.
Support and resistance. When price approaches a previous POC from above, the level can act as support. From below, it can act as resistance. Because many participants were positioned there, they often defend or react to it.
How to Find the POC on Your Chart
Most platforms offer a Volume Profile tool. On TradingView, look for Session Volume Profile or Fixed Range Volume Profile. On MetaTrader 5, you will need a Volume Profile indicator from the Market or a custom script. In the settings:
- Choose the volume type: TICK for Forex CFDs, REAL for futures or stocks.
- Select the period: session, day, week or a custom range.
- Set the value area to 70%, the standard setting.
- Enable POC, VAH and VAL lines so they extend to the right of the chart.
POC Trading Strategies
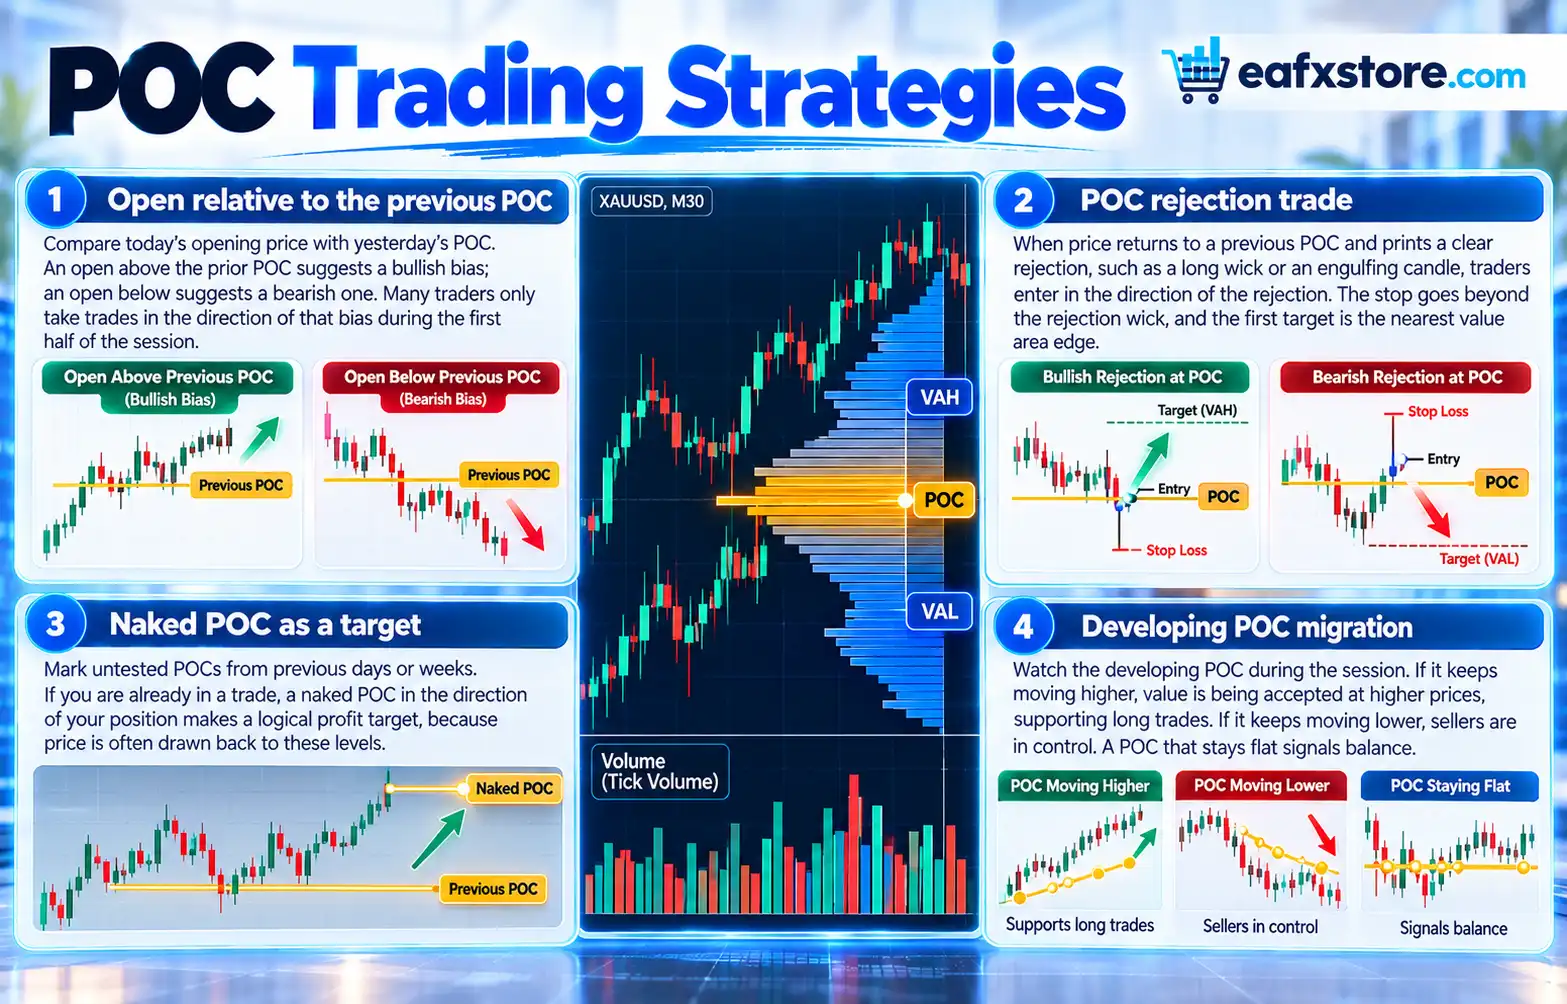
Open relative to the previous POC
Compare today’s opening price with yesterday’s POC. An open above the prior POC suggests a bullish bias; an open below suggests a bearish one. Many traders only take trades in the direction of that bias during the first half of the session.
POC rejection trade
When price returns to a previous POC and prints a clear rejection, such as a long wick or an engulfing candle, traders enter in the direction of the rejection. The stop goes beyond the rejection wick, and the first target is the nearest value area edge.
Naked POC as a target
Mark untested POCs from previous days or weeks. If you are already in a trade, a naked POC in the direction of your position makes a logical profit target, because price is often drawn back to these levels.
Developing POC migration
Watch the developing POC during the session. If it keeps moving higher, value is being accepted at higher prices, supporting long trades. If it keeps moving lower, sellers are in control. A POC that stays flat signals balance.
Combining the POC With Other Tools
The POC is strongest when it lines up with other evidence. A weekly POC that coincides with a round number, a daily pivot or a previous swing high is more likely to produce a reaction. You can also check the candle structure using OHLC analysis: a close back above the POC after a false break is often more meaningful than the touch itself.
Common Mistakes
- Treating the POC as an exact price instead of a zone of a few pips.
- Trading every touch without considering trend or session.
- Comparing POCs from different brokers’ tick data.
- Forgetting that a POC on a one-hour profile is far less important than a weekly or monthly POC.
Frequently Asked Questions
What does POC mean in trading?
POC stands for Point of Control, the price level with the highest volume within a Volume Profile.
Is the POC support or resistance?
It can be both. Price often finds support at a POC from above and resistance from below.
What is a naked POC?
A naked POC is a previous POC that price has not revisited yet. Traders often use it as a target.
Does the POC work in Forex?
Yes, though Forex profiles usually use tick volume, so treat the POC as a zone and cross-check important levels when possible.
Conclusion
The Point of Control is the backbone of Volume Profile trading. It tells you where the market found the most agreement and gives you a reference point for bias, entries and targets. Start by marking the previous day’s POC and watching how price behaves around it, then add the Value Area High and Value Area Low to build a complete picture.
Risk warning: Trading Forex and CFDs on margin carries a high level of risk and may not be suitable for all investors. This article is for educational purposes only and is not investment advice.