
Look at any Volume Profile and you will notice it is rarely a smooth, even shape. It has bulges where volume piles up and valleys where volume is thin. The bulges are called High Volume Nodes (HVNs), and they reveal the price zones where the market spent the most time and effort. For Forex traders, HVNs are some of the most dependable areas for targets, consolidation and reactions.
This guide explains what an HVN is, why price behaves differently around it, and how to use HVNs in your trading.
What is a High Volume Node?
A High Volume Node is a price zone within a Volume Profile where volume is significantly higher than at the surrounding prices. On the profile histogram it appears as a cluster of long bars, often forming a peak.
The largest HVN usually contains the Point of Control (POC), but a profile can have several HVNs. A profile with two clear peaks, often called a double distribution, shows that the market found value at two different price zones during the period.
On Forex CFD charts, HVNs are calculated from Tick Volume. They represent zones of heavy activity rather than exact contracts traded.
What an HVN Tells You
High volume at a price means participants were comfortable trading there for an extended time. Buyers and sellers reached a balance. This has three important implications:
- Acceptance. The market views the HVN price zone as fair value.
- Slower movement. When price returns to an HVN, it often slows down, chops and consolidates, because there are many resting orders and interested participants there.
- Memory. Traders who opened positions in the HVN will react when price comes back, defending or closing positions.
Because of this, HVNs often behave like magnets and pause zones, while their opposite, Low Volume Nodes (LVNs), behave like fast lanes.
HVN vs LVN
| Feature | High Volume Node | Low Volume Node |
| Volume | Heavy | Light |
| Market meaning | Acceptance, balance | Rejection, imbalance |
| Typical price behaviour | Slows down, consolidates | Moves quickly through |
| Common use | Targets, ranges | Entries, stops, breakouts |
How to Trade High Volume Nodes
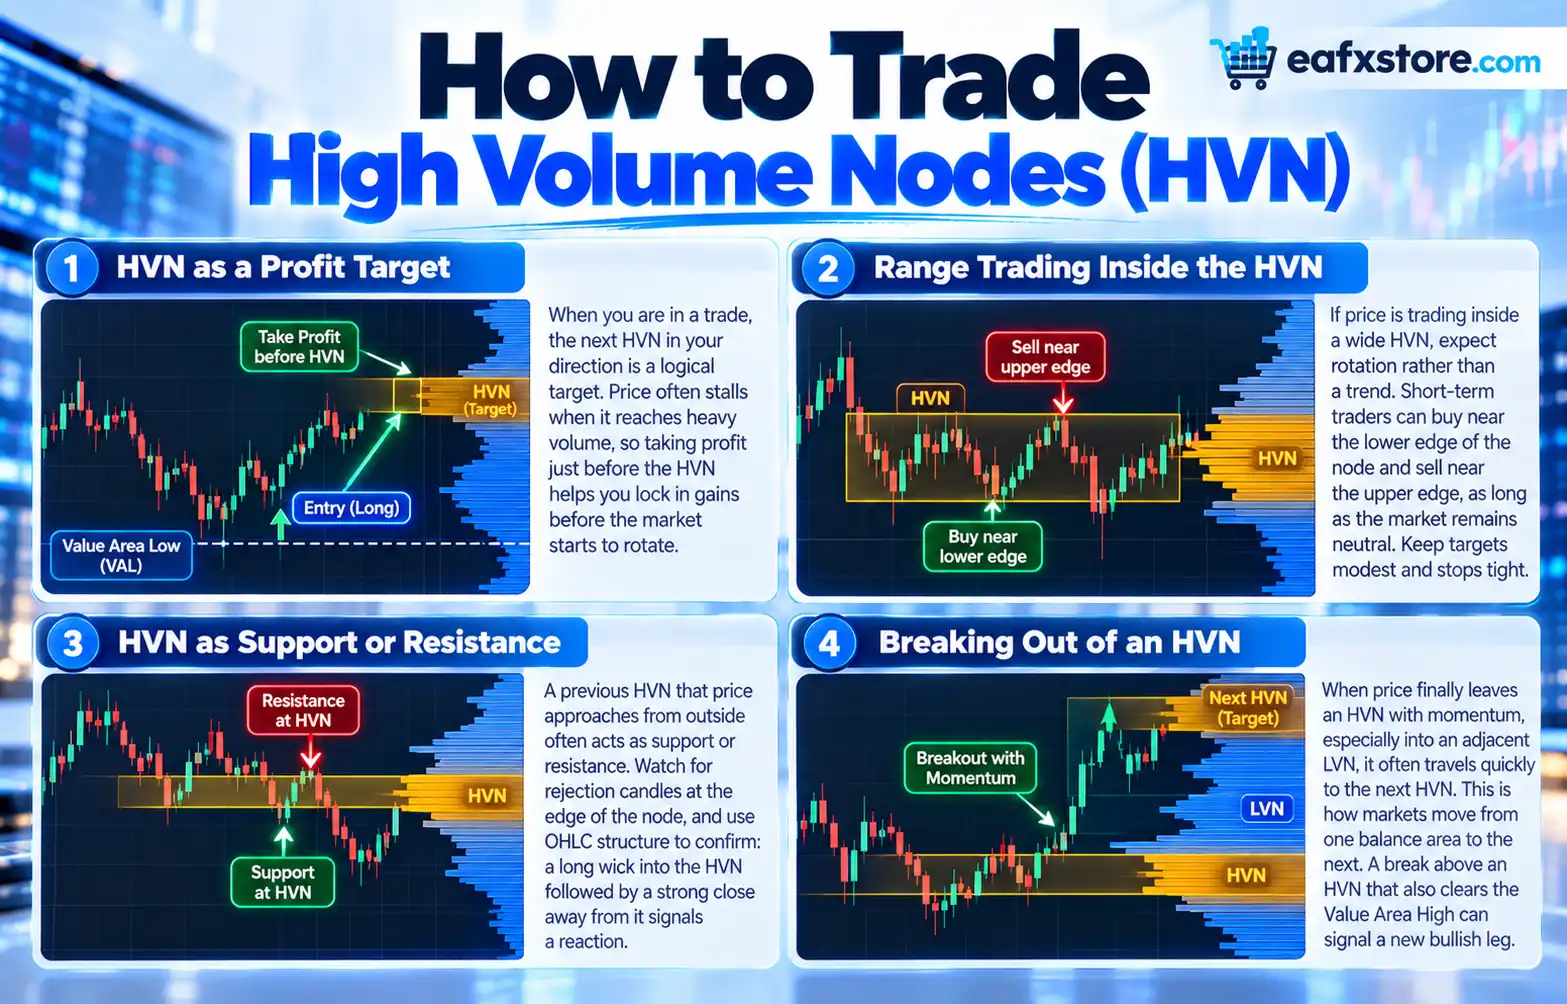
HVN as a profit target
When you are in a trade, the next HVN in your direction is a logical target. Price often stalls when it reaches heavy volume, so taking profit just before the HVN helps you lock in gains before the market starts to rotate. For example, a long trade from the Value Area Low might target the HVN around the POC.
Range trading inside the HVN
If price is trading inside a wide HVN, expect rotation rather than a trend. Short-term traders can buy near the lower edge of the node and sell near the upper edge, as long as the market remains Neutral. Keep targets modest and stops tight.
HVN as support or resistance
A previous HVN that price approaches from outside often acts as support or resistance. Watch for rejection candles at the edge of the node, and use OHLC structure to confirm: a long wick into the HVN followed by a strong close away from it signals a reaction.
Breaking out of an HVN
When price finally leaves an HVN with momentum, especially into an adjacent LVN, it often travels quickly to the next HVN. This is how markets move from one balance area to the next. A break above an HVN that also clears the Value Area High can signal a new Bullish leg.
Finding HVNs on Your Chart
- Use a Fixed Range Volume Profile over a clear swing or a full week to see the main nodes.
- Increase the number of rows (price levels) in the profile to reveal the shape more clearly.
- Mark the edges of each HVN, not just its peak. The edges are where reactions usually begin.
- Compare the current HVNs with those on higher-timeframe profiles. An HVN that appears on both the daily and weekly profile is more significant.
Common Mistakes
- Expecting fast breakouts inside an HVN, where price naturally slows down.
- Placing stops in the middle of an HVN, where normal chop can trigger them.
- Treating a small bump in the profile as a major node.
- Ignoring higher-timeframe context when lower-timeframe profiles show conflicting nodes.
Frequently Asked Questions
What is an HVN in trading?
An HVN, or High Volume Node, is a price zone in a Volume Profile with significantly higher volume than the surrounding prices.
Is the POC an HVN?
The POC sits inside the largest HVN, but a profile can have several HVNs in addition to the one containing the POC.
Why does price slow down at an HVN?
Many participants traded there, so there are more orders and more interest, which creates balance and consolidation.
Are HVNs support or resistance?
They can act as both, and they are especially useful as profit targets.
Conclusion
High Volume Nodes show where the market agreed on value and spent the most effort. They help you set realistic targets, recognise when to expect consolidation and spot the zones other traders will defend. Pair them with Low Volume Nodes and you can read how price travels from one balance zone to the next.
Risk warning: Trading Forex and CFDs on margin carries a high level of risk and may not be suitable for all investors. This article is for educational purposes only and is not investment advice.