
Open the volume indicator on almost any MetaTrader Forex chart and you will see bars rising and falling with each candle. What most traders do not realise is that those bars are not showing how many lots were traded. They show tick volume, a measure of how often the price changed. Understanding this difference is essential if you use Volume Profile, POC or value areas in your trading.
In this guide you will learn what tick volume is, why Forex platforms use it, how reliable it is, and how to use it effectively.
What is Tick Volume?
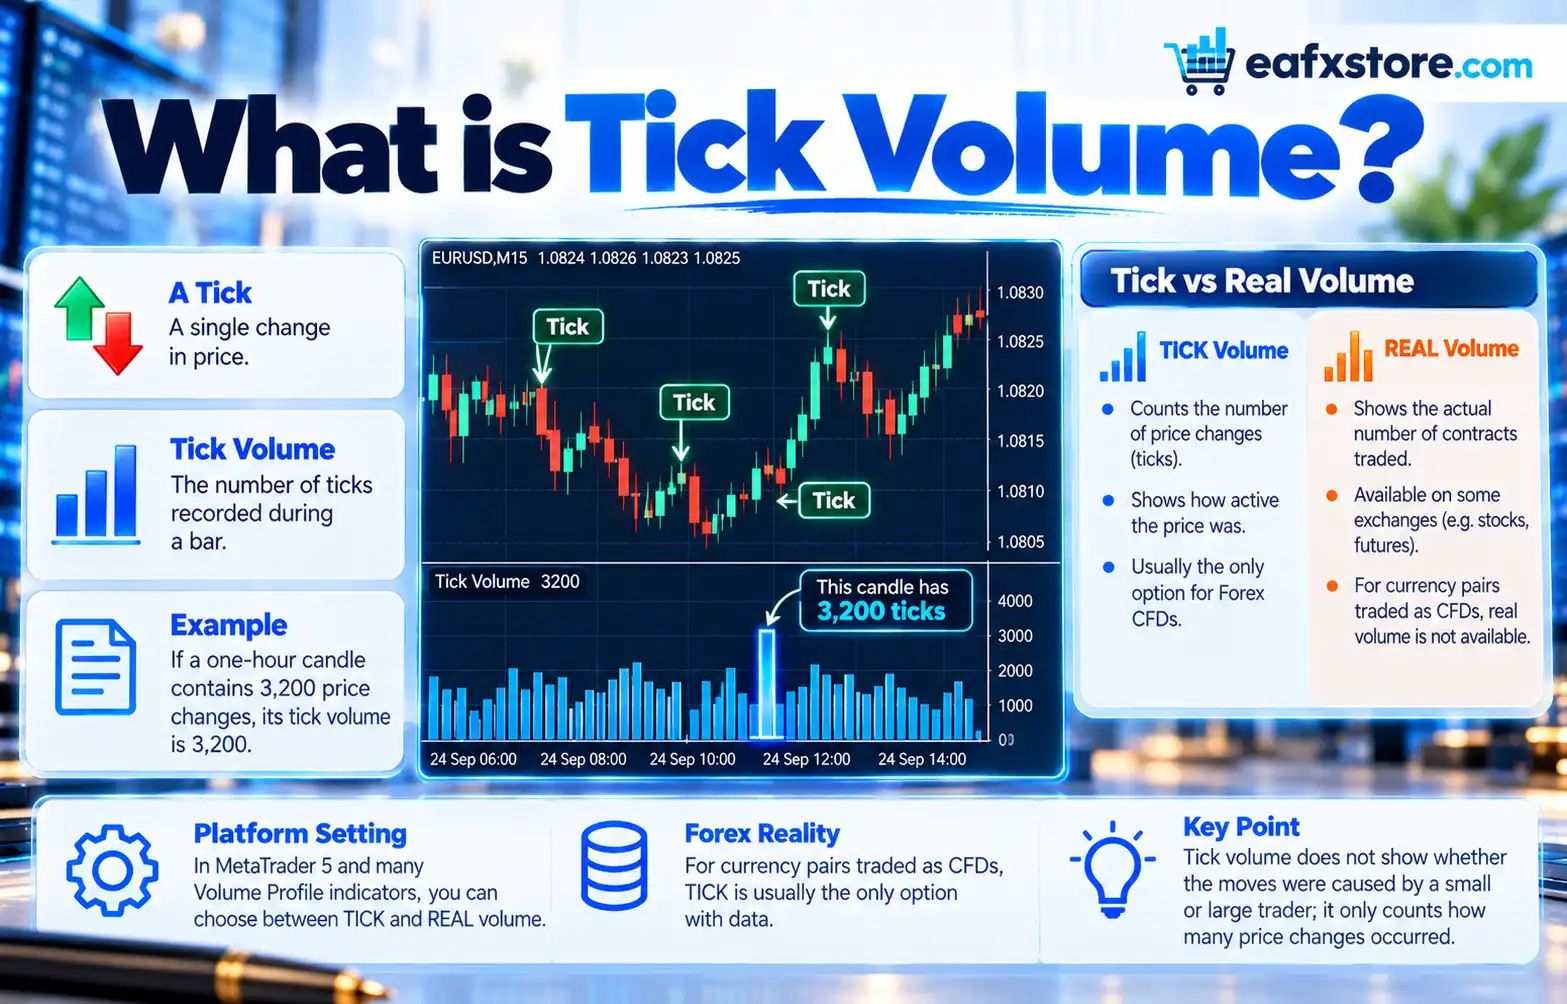
A tick is a single change in price. Every time the bid or ask price of EUR/USD moves, even by a fraction of a pip, that counts as one tick. Tick volume is the number of ticks recorded during a bar.
If a one-hour candle contains 3,200 price changes, its tick volume is 3,200. The indicator says nothing about whether those changes were caused by one trader buying 1 lot or a bank buying 500 lots; it only counts how active the price was.
In MetaTrader 5 and many Volume Profile indicators, you will see a setting that lets you choose between TICK and REAL volume. For currency pairs traded as CFDs, TICK is usually the only option with data.
Why Forex Uses Tick Volume
The spot currency market has no central exchange, so there is no single record of how much was traded. Each broker receives prices from its own liquidity providers and cannot see the rest of the market. Without access to real volume, platforms use the next best thing: the frequency of price updates in the broker’s own feed.
The logic is simple. When more participants are trading, prices update more often. When the market is quiet, prices update less often. Tick volume therefore acts as a proxy for activity.
How Reliable is Tick Volume?
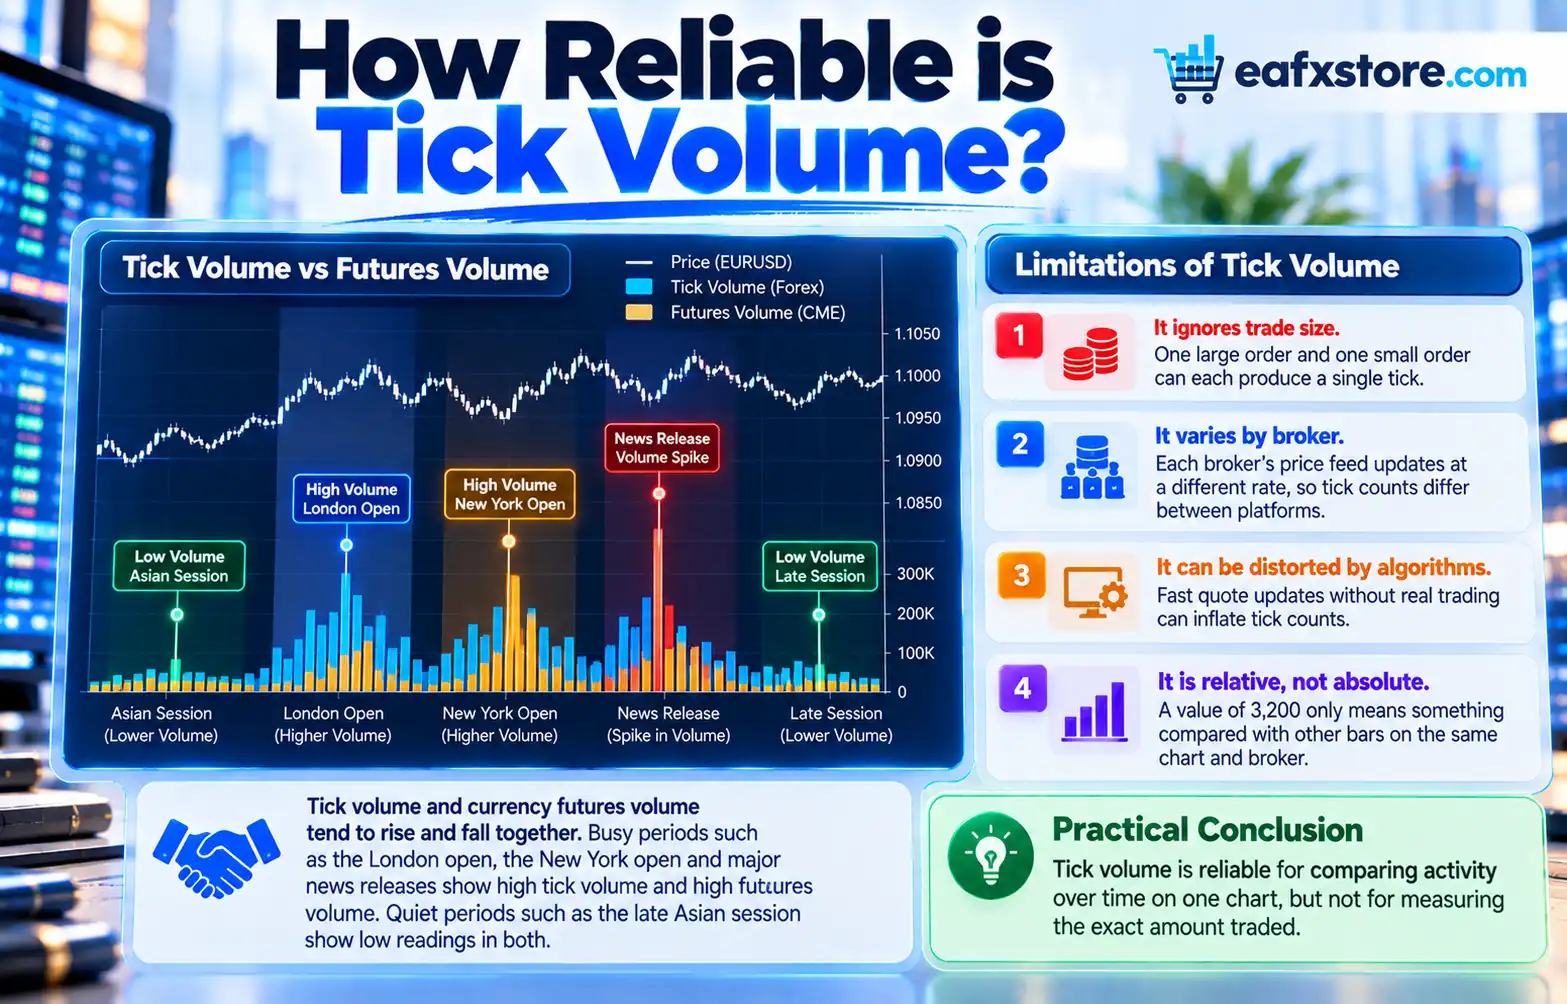
Many traders and analysts who have compared tick volume with currency futures volume found that the two tend to rise and fall together. Busy periods such as the London open, the New York open and major news releases show high tick volume and high futures volume. Quiet periods such as the late Asian session show low readings in both.
However, tick volume has clear limitations:
- It ignores trade size. One large order and one small order can each produce a single tick.
- It varies by broker. Each broker’s price feed updates at a different rate, so tick counts differ between platforms.
- It can be distorted by algorithms. Fast quote updates without real trading can inflate tick counts.
- It is relative, not absolute. A value of 3,200 only means something compared with other bars on the same chart and broker.
The practical conclusion: tick volume is reliable for comparing activity over time on one chart, but not for measuring the exact amount traded.
Using Tick Volume With Volume Profile
When you build a Volume Profile on a Forex CFD chart, the indicator distributes each bar’s tick volume across the price levels that bar touched. The result shows where price spent the most activity, and from it you get the key levels:
- Point of Control (POC): the price with the highest tick activity.
- Value Area High (VAH) and Value Area Low (VAL): the upper and lower boundaries of the zone containing about 70% of the activity.
- High Volume Nodes (HVN): zones of heavy activity where price tends to slow down.
- Low Volume Nodes (LVN): thin zones where price tends to move quickly.
Because these levels come from tick data, they are best treated as zones rather than exact prices. A POC calculated on one broker may sit a few pips away from the POC on another.
Practical Tips for Trading With Tick Volume
- Compare, do not count. Look for bars with unusually high or low tick volume relative to recent bars, rather than focusing on the raw number.
- Use lower timeframe data for profiles. Building a profile from one-minute data spreads tick volume more accurately than using hourly bars.
- Watch volume at key levels. A rise in tick volume as price breaks the VAH supports the breakout; a breakout on falling tick volume deserves suspicion.
- Mind the session. Tick volume naturally drops in the Asian session and rises at the London and New York opens. Compare like with like.
- Cross-check with futures when possible. If a level matters to your trade, compare it with the equivalent currency futures profile.
- Stick with one broker’s data. Switching brokers changes the tick feed and therefore your levels.
Tick Volume vs Real Volume at a Glance
Real volume measures how much was traded; tick volume measures how often the price moved. Real volume comes from exchanges; tick volume comes from your broker’s feed. Real volume is precise but rare in Forex; tick volume is approximate but available on almost every chart.
Frequently Asked Questions
What is tick volume in Forex?
It is the number of price changes during a bar, used as a substitute for traded volume in the decentralised currency market.
Is tick volume accurate?
It is a good relative measure of activity, but it does not show the size of trades and varies between brokers.
Should I choose TICK or REAL in my Volume Profile indicator?
For Forex CFDs, choose TICK, because real volume is usually unavailable. For futures or stocks, choose REAL.
Why is my tick volume different from my friend’s?
You are probably using different brokers, each with its own price feed and update frequency.
Conclusion
Tick volume is not perfect, but it is the most practical volume measure for Forex traders. Used correctly, as a relative gauge of activity on one consistent data feed, it powers useful Volume Profile levels like the POC, VAH and VAL. Pair it with sound price action, which starts with reading OHLC candles, and it becomes a valuable part of your toolkit.
Risk warning: Trading Forex and CFDs on margin carries a high level of risk and may not be suitable for all investors. This article is for educational purposes only and is not investment advice.