
Most traders look at price and volume separately. Volume Spread Analysis (VSA) looks at them together, one candle at a time, to answer a single question: what are professional traders doing right now? By comparing how much volume went into a bar with how far price actually moved and where it closed, VSA helps you spot hidden buying, hidden selling and moves that are running out of fuel.
This guide explains the principles of VSA, the most important VSA signals, how to apply them in Forex and the limits you should keep in mind.
What is Volume Spread Analysis?
Volume Spread Analysis is a method of reading charts by studying the relationship between three elements of each bar:
- Volume: how much activity took place.
- Spread: the range of the bar, from high to low.
- Close: where the bar closed within its range (high, middle or low).
VSA was developed by Tom Williams, a former syndicate trader, who built on the work of Richard Wyckoff, one of the pioneers of technical analysis in the early twentieth century. Williams described the approach in his book Master the Markets.
The core belief behind VSA is that large professional traders, often called smart money, cannot hide their activity completely. Their buying and selling leaves traces in volume and price, and those traces can be read on any chart.
The Three Pillars of VSA
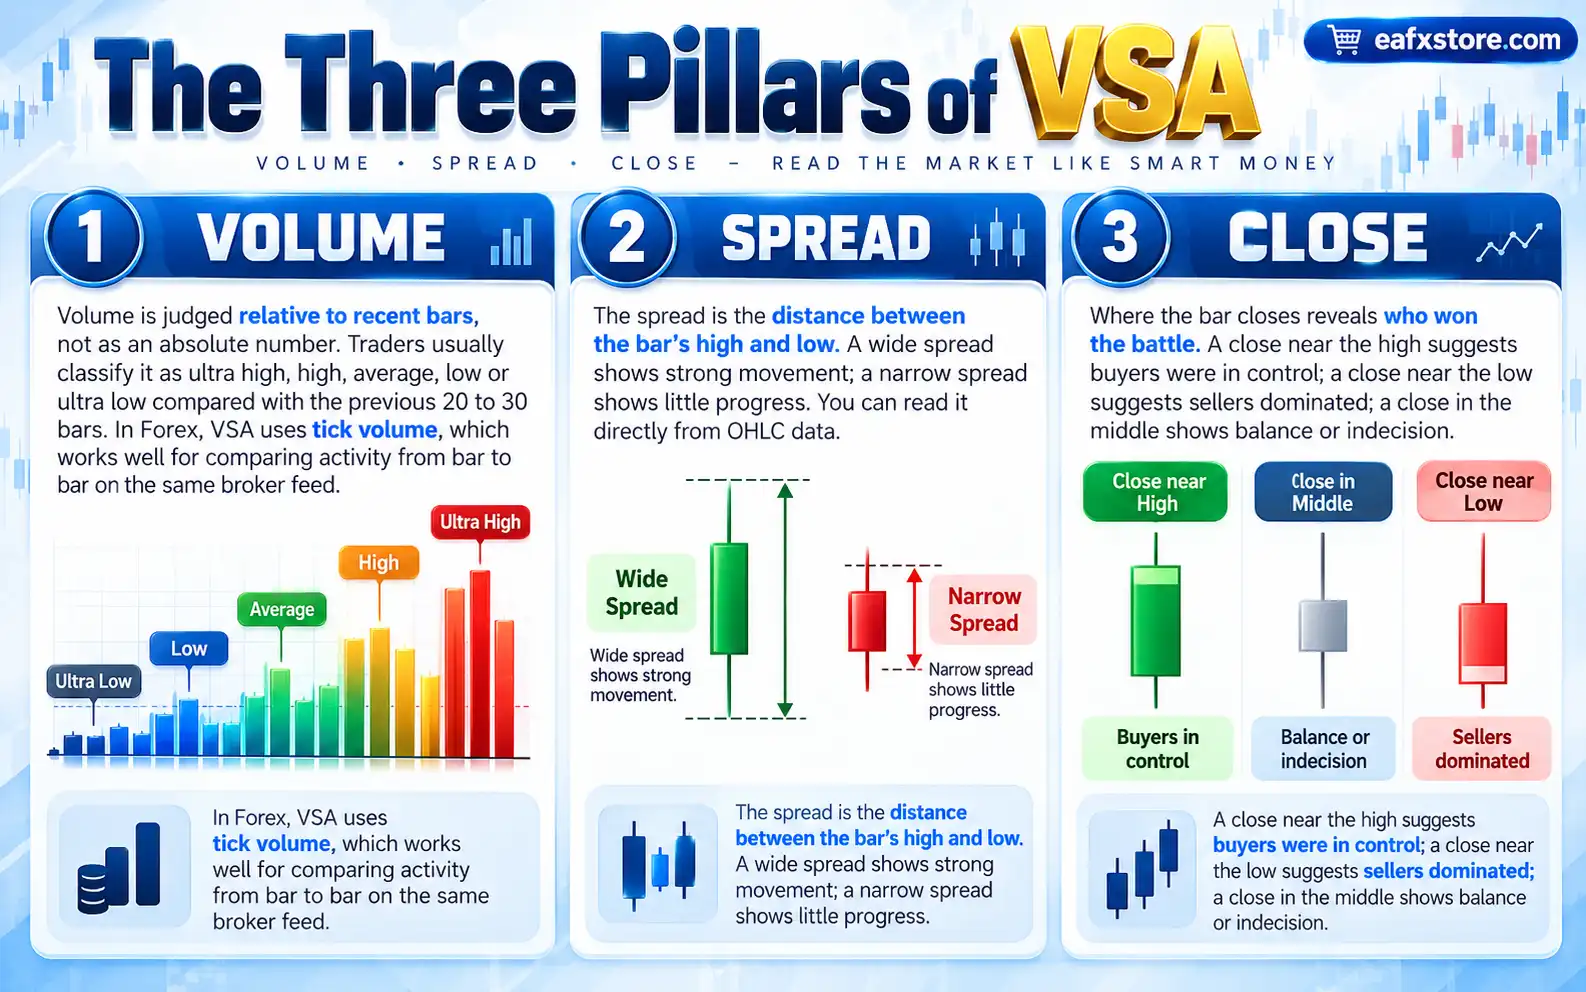
Volume
Volume is judged relative to recent bars, not as an absolute number. Traders usually classify it as ultra high, high, average, low or ultra low compared with the previous 20 to 30 bars. In Forex, VSA uses tick volume, which works well for comparing activity from bar to bar on the same broker feed.
Spread
The spread is the distance between the bar’s high and low. A wide spread shows strong movement; a narrow spread shows little progress. You can read it directly from OHLC data.
Close
Where the bar closes reveals who won the battle. A close near the high suggests buyers were in control; a close near the low suggests sellers dominated; a close in the middle shows balance or indecision.
Effort vs Result: The Heart of VSA
VSA builds on Wyckoff’s law of effort versus result. Volume is the effort; the price movement is the result.
- Harmony: high volume with a wide spread in the direction of the trend shows genuine strength or weakness.
- Divergence: high volume with a narrow spread means a lot of effort produced little result. Someone is absorbing the move, which often warns of a reversal.
- Low effort, big result: a wide move on low volume suggests a lack of opposition, but it may not be sustainable.
When effort and result disagree, VSA traders pay close attention.
Key VSA Signals
Signs of weakness
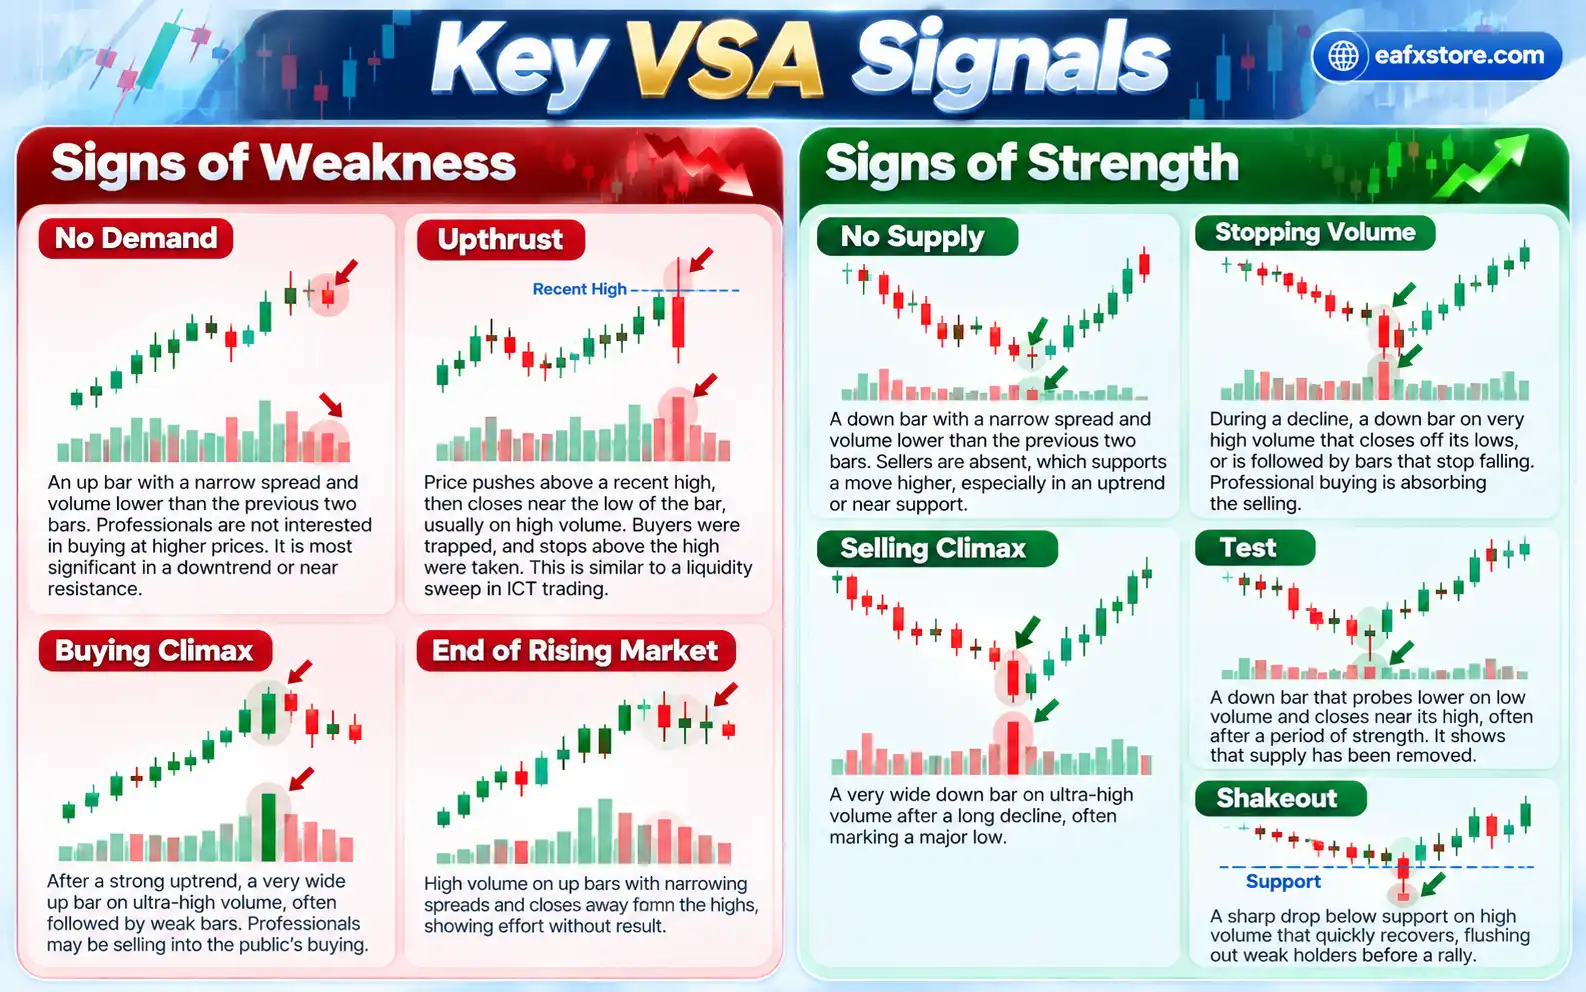
- No Demand: an up bar with a narrow spread and volume lower than the previous two bars. Professionals are not interested in buying at higher prices. It is most significant in a downtrend or near resistance.
- Upthrust: price pushes above a recent high, then closes near the low of the bar, usually on high volume. Buyers were trapped, and stops above the high were taken. This is similar to a liquidity sweep in ICT trading.
- Buying Climax: after a strong uptrend, a very wide up bar on ultra-high volume, often followed by weak bars. Professionals may be selling into the public’s buying.
- End of Rising Market: high volume on up bars with narrowing spreads and closes away from the highs, showing effort without result.
Signs of strength
- No Supply: a down bar with a narrow spread and volume lower than the previous two bars. Sellers are absent, which supports a move higher, especially in an uptrend or near support.
- Stopping Volume: during a decline, a down bar on very high volume that closes off its lows, or is followed by bars that stop falling. Professional buying is absorbing the selling.
- Selling Climax: a very wide down bar on ultra-high volume after a long decline, often marking a major low.
- Test: a down bar that probes lower on low volume and closes near its high, often after a period of strength. It shows that supply has been removed.
- Shakeout: a sharp drop below support on high volume that quickly recovers, flushing out weak holders before a rally.
Background Matters
A single bar means little on its own. VSA always reads signals in their background, the preceding trend and recent volume behaviour.
- A No Demand bar after a strong rally into resistance is a meaningful warning.
- The same bar in the middle of a quiet range may mean nothing.
- Stopping Volume after a long bearish move carries more weight than a high-volume bar in a sideways market.
Ask three questions before acting on any VSA signal: What is the trend? Where is price relative to key levels? What happened on the last few bars?
How to Trade VSA in Forex
Here is a simple process for a long trade. Reverse it for shorts.
- Define the background. Use a higher timeframe to identify the trend and key support levels.
- Look for signs of strength near support, such as Stopping Volume, a Shakeout or a Selling Climax.
- Wait for confirmation, such as a successful Test or a No Supply bar on low volume.
- Enter above the high of the confirming bar.
- Place the stop below the low of the strength signal.
- Target the next resistance, a High Volume Node or the Value Area High.
- Watch for signs of weakness, such as No Demand or an Upthrust, to manage or exit the trade.
Combining VSA With Volume Profile
VSA reads volume through time, bar by bar. Volume Profile reads volume across price. Together, they give a fuller picture:
- Stopping Volume at the Value Area Low combines a VSA strength signal with a key value level.
- An Upthrust above the Value Area High, followed by a close back inside value, is a strong bearish clue.
- A No Supply bar near the Point of Control during an uptrend suggests sellers are not defending fair value.
Signals during active sessions, such as the London and New York Kill Zones, are usually more reliable, because volume is higher and more representative.
Limitations of VSA in Forex
- Tick volume, not real volume. Forex VSA relies on tick volume, which reflects activity but not trade size. For exchange volume, some traders apply VSA to currency futures with real volume.
- Broker differences. Tick counts vary between brokers, so signals may differ slightly.
- Subjectivity. Judging “high” volume or a “narrow” spread involves interpretation. VSA indicators can help by classifying bars automatically.
- Session effects. Volume naturally rises at session opens and falls in quiet hours, which can distort comparisons. Compare bars within similar sessions.
Frequently Asked Questions
What is Volume Spread Analysis?
It is a chart-reading method that studies volume, bar spread and closing price together to identify professional buying and selling.
Who created VSA?
Tom Williams developed VSA, building on the earlier work of Richard Wyckoff.
What is a No Demand bar?
An up bar with a narrow spread and lower volume than the previous two bars, showing a lack of professional buying interest.
Does VSA work in Forex?
It can, using tick volume as a proxy for activity. Read signals in context and stay consistent with one broker’s data.
Conclusion
Volume Spread Analysis teaches you to read each bar as evidence of what professional traders are doing. By comparing effort with result, recognising signals like No Demand, Upthrust, Stopping Volume and Tests, and always reading them in their background, you can spot hidden strength and weakness before they show up in the trend. Combine VSA with Volume Profile levels and sound risk management, and it becomes a powerful lens for understanding the Forex market.
Risk warning: Trading Forex and CFDs on margin carries a high level of risk and may not be suitable for all investors. This article is for educational purposes only and is not investment advice.