Strategy: Boost Your Forex Profits 2")
Introduction
In the fast-paced world of Forex trading, identifying the right entry and exit points can make the difference between consistent profits and repeated losses. Among the many technical indicators available, the Relative Strength Index (RSI) stands out as one of the most powerful and widely used tools. Developed by J. Welles Wilder, RSI helps traders measure the speed and change of price movements, providing valuable insights into market momentum.
This blog will walk you through everything you need to know about RSI—from its fundamentals to advanced strategies—so you can effectively use it to boost your Forex trading profits.
 Strategy: Boost Your Forex Profits 3")
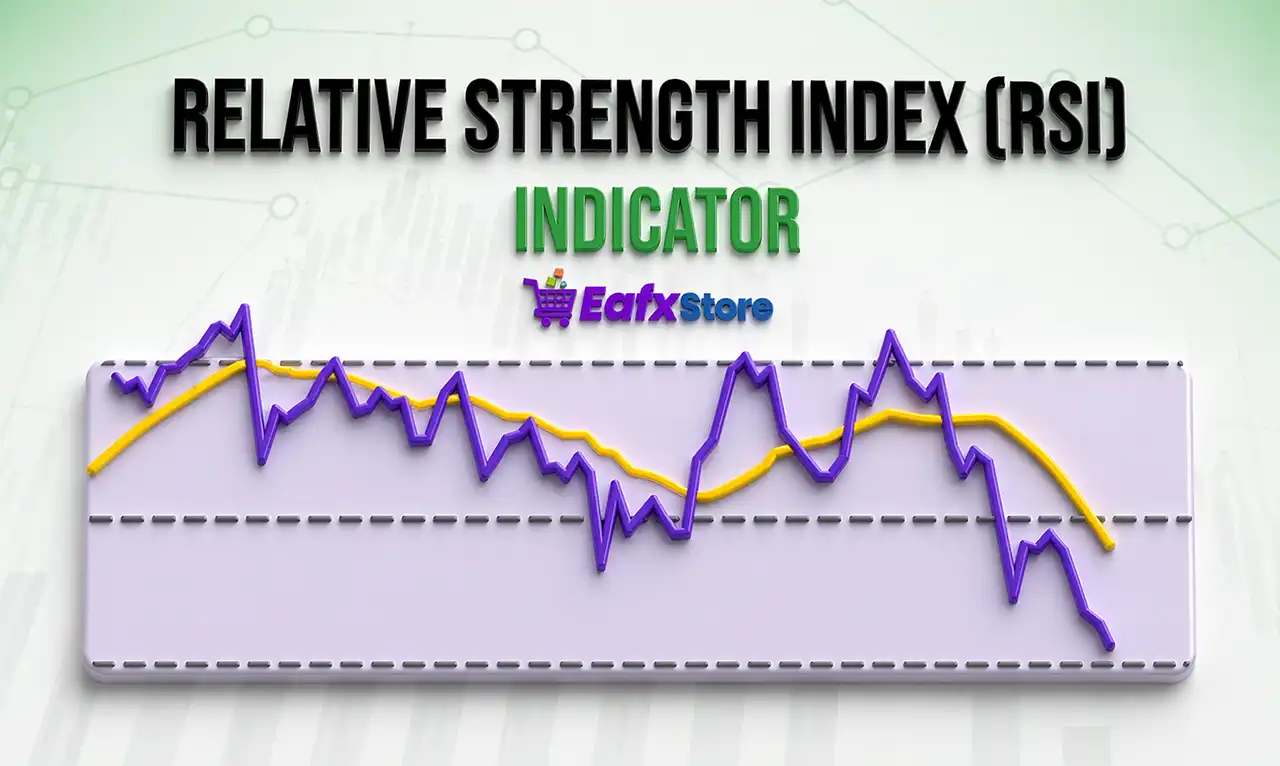
What is the Relative Strength Index (RSI)?
The Relative Strength Index (RSI) is a momentum oscillator that ranges from 0 to 100. It is primarily used to identify overbought and oversold conditions in the market.
- RSI above 70 → Overbought condition (potential sell signal)
- RSI below 30 → Oversold condition (potential buy signal)
The RSI is calculated using average gains and losses over a specified period, typically 14 periods.
Why RSI Matters in Forex
Forex markets are highly volatile and influenced by multiple factors. RSI helps traders:
- Identify trend reversals
- Confirm trend strength
- Avoid entering trades at extreme price levels
- Improve timing of trades
How RSI Works
RSI compares the magnitude of recent gains to recent losses. This allows traders to understand whether buyers or sellers are dominating the market.
Key Components
- Momentum Measurement – Shows how fast price is moving
- Overbought/Oversold Levels – Highlights potential reversal zones
- Divergence Signals – Indicates possible trend changes
Example
If EUR/USD has been rising consistently, RSI may climb above 70, signaling that the pair could be overbought and due for a correction.
RSI Trading Strategies for Forex
1. Overbought and Oversold Strategy
This is the most basic and widely used RSI strategy.
How it works:
- Buy when RSI crosses above 30 (from below)
- Sell when RSI crosses below 70 (from above)
Best for: Range-bound markets
Tip: Avoid using this strategy alone in strong trending markets, as RSI can stay overbought or oversold for extended periods.
 Strategy: Boost Your Forex Profits 4")
2. RSI Divergence Strategy
Divergence occurs when price moves in the opposite direction of RSI.
Types of Divergence:
- Bullish Divergence: Price makes lower lows, RSI makes higher lows → Buy signal
- Bearish Divergence: Price makes higher highs, RSI makes lower highs → Sell signal
Why it works:
It reveals weakening momentum, often before a reversal happens.
3. RSI Trend Confirmation Strategy
Instead of using RSI to predict reversals, you can use it to confirm trends.
Rules:
- RSI above 50 → Bullish trend
- RSI below 50 → Bearish trend
Entry Idea:
- Buy when RSI is above 50 and price pulls back
- Sell when RSI is below 50 and price retraces upward
Best for: Trending markets
4. RSI Swing Rejection Strategy
This is a more advanced RSI technique that focuses on momentum shifts.
Bullish Swing Rejection:
- RSI falls below 30
- RSI rises above 30
- RSI pulls back but stays above 30
- RSI breaks previous high → Buy signal
Bearish Swing Rejection:
- RSI rises above 70
- RSI falls below 70
- RSI rises again but stays below 70
- RSI breaks previous low → Sell signal
Why it’s powerful:
It filters out false signals and confirms momentum shifts.
5. Combining RSI with Other Indicators
Using RSI alone can be risky. Combining it with other tools increases accuracy.
Popular combinations:
- RSI + Moving Average
- Confirm trend direction with MA
- Use RSI for entry timing
- RSI + Support/Resistance
- Look for RSI signals near key levels
- RSI + MACD
- Confirm momentum with two indicators
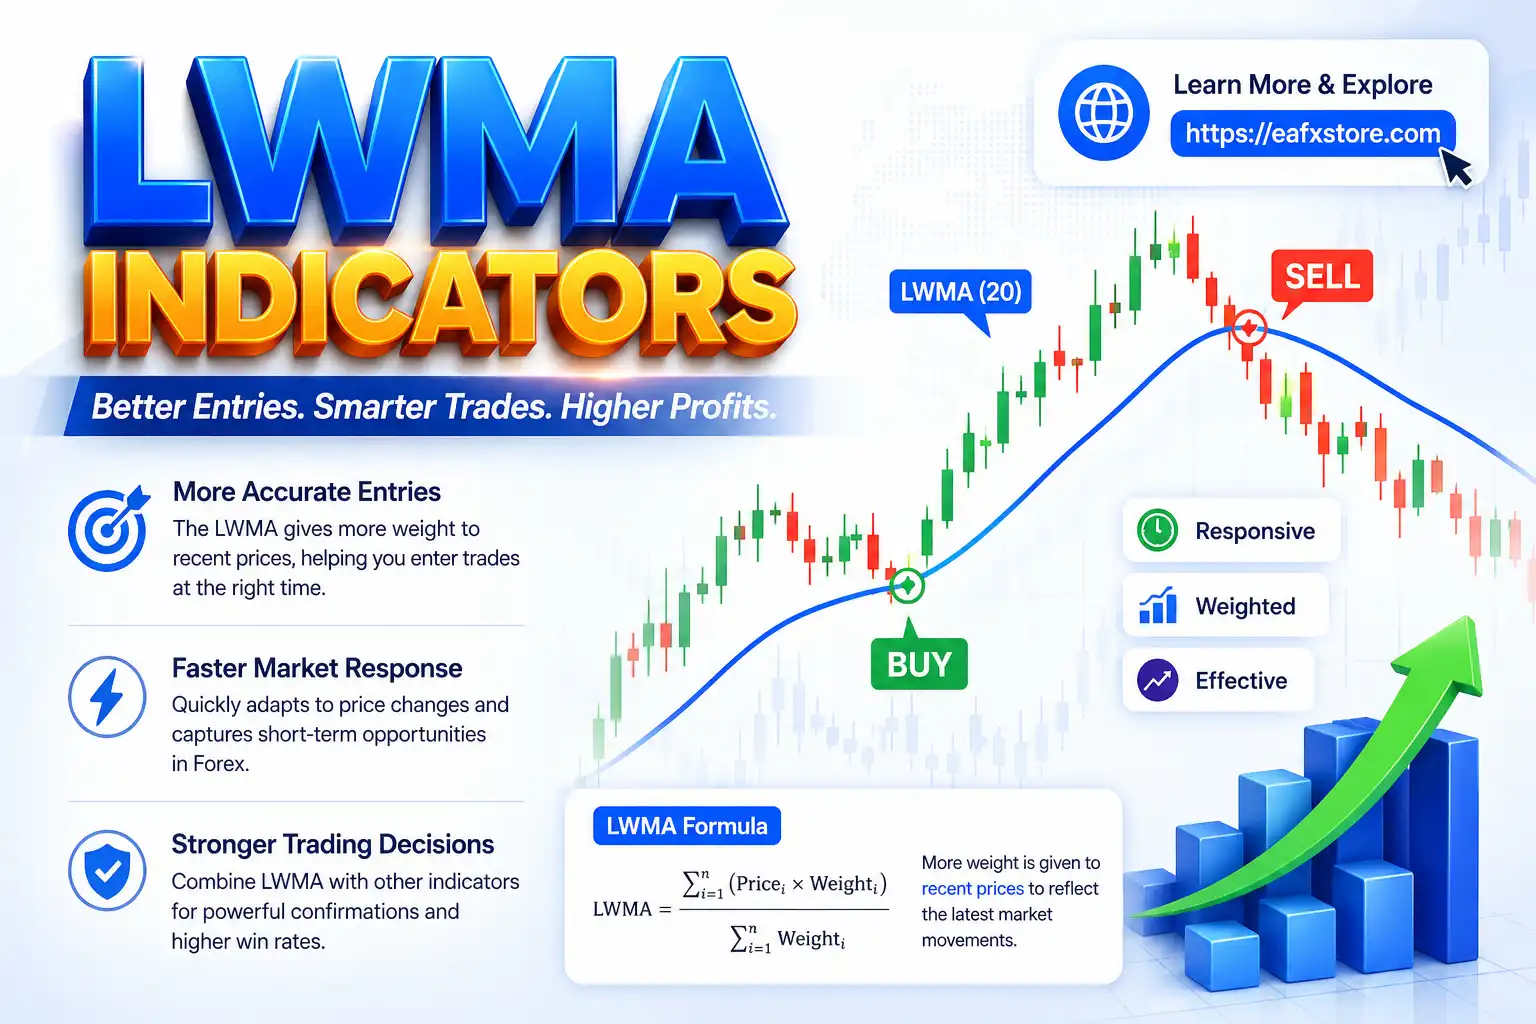
Best RSI Settings for Forex Trading
The default RSI setting is 14 periods, but you can adjust it based on your trading style.
| Trading Style | RSI Setting |
|---|---|
| Scalping | 5–9 |
| Day Trading | 9–14 |
| Swing Trading | 14–21 |
Pro Tip:
- Lower settings → More signals (but less reliable)
- Higher settings → Fewer signals (but more accurate)
Common Mistakes When Using RSI
Even though RSI is powerful, many traders misuse it.
1. Ignoring Market Trends
RSI can stay overbought in strong uptrends and oversold in strong downtrends. Blindly selling or buying can lead to losses.
2. Using RSI Alone
Always combine RSI with other indicators or price action analysis.
3. Overtrading
Too many signals can tempt traders to overtrade. Stick to high-probability setups.
4. Not Adjusting Settings
Different markets and timeframes require different RSI settings.
Practical Example of RSI Strategy
Let’s say you are trading GBP/USD on a 1-hour chart:
- Price approaches a strong support level
- RSI drops below 30 (oversold)
- RSI crosses back above 30
- You enter a buy trade
- Exit when RSI approaches 70 or resistance level
This simple setup can yield consistent results when applied with discipline.
Risk Management with RSI
No strategy is complete without proper risk management.
Key Rules:
- Never risk more than 1–2% per trade
- Use stop-loss orders
- Avoid trading during major news events
- Maintain a risk-reward ratio of at least 1:2
RSI improves entries, but risk management protects your capital.
Advantages of Using RSI
- Easy to understand and use
- Works across multiple timeframes
- Helps identify reversals and trends
- Suitable for beginners and professionals
Limitations of RSI
- Can give false signals in strong trends
- Not effective as a standalone tool
- Requires confirmation from other indicators
Advanced Tips to Boost Your RSI Strategy
1. Use RSI Zones Instead of Fixed Levels
Instead of strict 70/30 levels, consider:
- 80/20 in strong trends
- 60/40 in mild trends
2. Multi-Timeframe Analysis
Check RSI on higher timeframes to confirm overall trend before entering trades on lower timeframes.
3. Combine with Price Action
Look for candlestick patterns (pin bars, engulfing candles) alongside RSI signals for stronger confirmation.
Conclusion
The Relative Strength Index (RSI) is one of the most versatile and effective tools in Forex trading. Whether you are a beginner or an experienced trader, mastering RSI can significantly enhance your decision-making and profitability.
However, RSI is not a magic formula. Its true power lies in how you combine it with other tools, apply proper risk management and maintain discipline in your trading approach.
By understanding and implementing the strategies discussed in this guide, you can confidently use RSI to identify high-probability trade setups and boost your Forex profits.
FAQs
1. Is RSI good for Forex trading?
Yes, RSI is highly effective for identifying momentum, overbought/oversold conditions, and potential reversals in Forex markets.
2. What timeframe works best with RSI?
RSI works on all timeframes, but it is most reliable on higher timeframes like 1-hour, 4-hour, and daily charts.
3. Can beginners use RSI?
Absolutely. RSI is beginner-friendly and easy to understand.
4. What is the best RSI strategy?
There is no single “best” strategy. Combining RSI with trend analysis and support/resistance levels yields the best results.