: Complete Guide for Forex Traders 2")
What is the Relative Strength Index (RSI)?
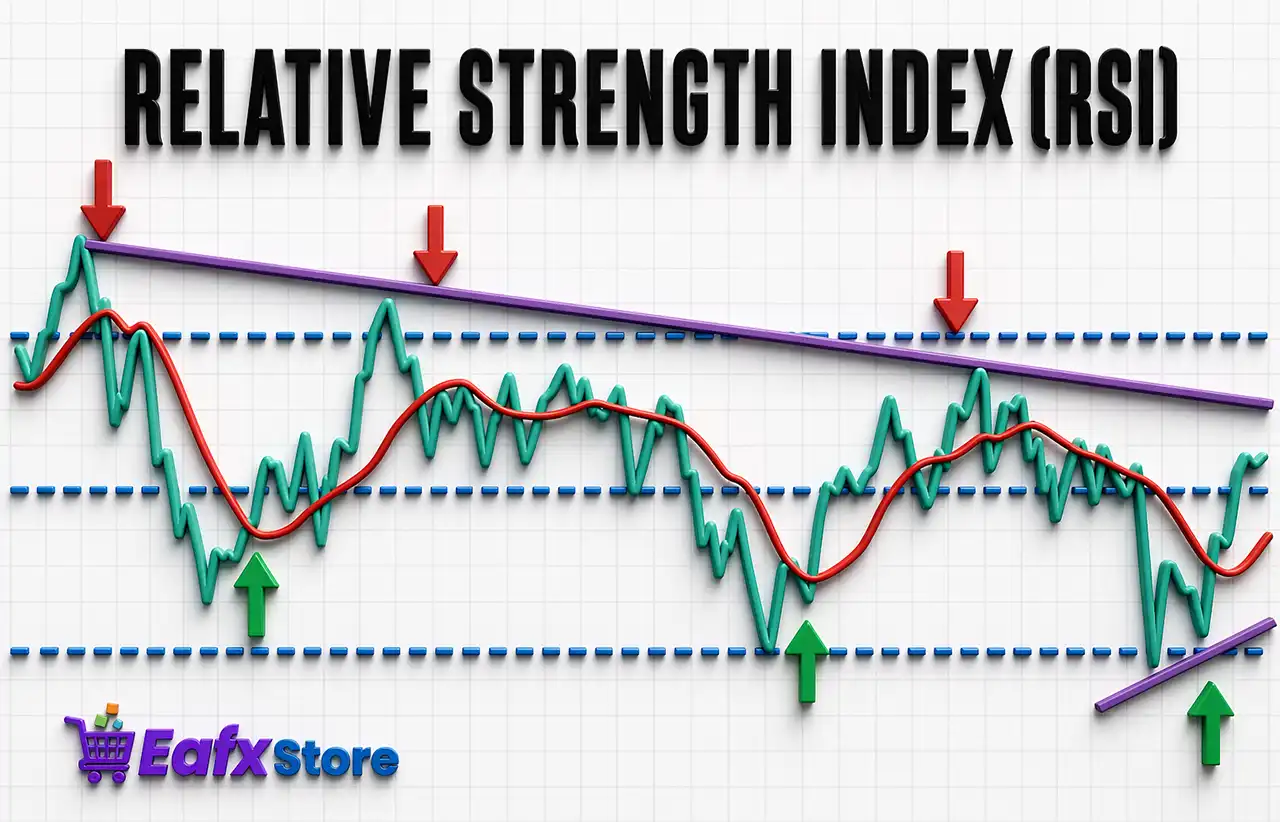
The Relative Strength Index (RSI) is a momentum oscillator developed by J. Welles Wilder Jr. in 1978. It measures the speed and magnitude of price movements, helping traders identify overbought and oversold conditions in the market.
RSI is displayed as a line graph that moves between 0 and 100.
Key Levels:
- Above 70 → Overbought (potential sell signal).
- Below 30 → Oversold (potential buy signal).
- 50 Level → Neutral trend indicator.
: Complete Guide for Forex Traders 3")
How RSI Works
RSI calculates the average gains and losses over a specific period, typically 14 periods. It then converts this information into a value between 0 and 100.
Basic Interpretation:
- RSI rising → Bullish momentum increasing.
- RSI falling → Bearish momentum increasing.
The indicator does not predict price direction but helps identify potential reversal zones.
: Complete Guide for Forex Traders 4")
Why RSI is Important in Forex Trading
Forex markets are highly volatile and price movements can change rapidly. RSI helps traders:
- Identify overbought and oversold conditions.
- Spot potential trend reversals.
- Confirm trend strength.
- Avoid entering trades at extreme price levels.
Because of its simplicity and effectiveness, RSI is widely used across all timeframes—from scalping to long-term trading.
: Complete Guide for Forex Traders 5")
How to Use RSI in Forex Trading
1. Overbought and Oversold Strategy
This is the most basic and commonly used RSI strategy.
- RSI > 70 → Market may be overbought → Look for sell opportunities
- RSI < 30 → Market may be oversold → Look for buy opportunities
However, one mistake traders often make is assuming price will reverse immediately. In strong trends, RSI can stay overbought or oversold for extended periods.
👉 Tip: Always combine RSI with other indicators like support/resistance or trendlines.
2. RSI Divergence Strategy
Divergence occurs when the price moves in the opposite direction of RSI.
Types of Divergence:
- Bullish Divergence
- Price makes lower lows
- RSI makes higher lows
→ Possible upward reversal
- Bearish Divergence
- Price makes higher highs
- RSI makes lower highs
→ Possible downward reversal
Divergence is one of the most powerful RSI signals, especially in Forex markets.
: Complete Guide for Forex Traders 6")
3. RSI Trend Confirmation
RSI can also be used to confirm trends:
- RSI above 50 → Bullish trend
- RSI below 50 → Bearish trend
This method helps traders stay aligned with the overall market direction instead of trading against it.
4. RSI Swing Rejections
Swing rejection is a lesser-known but highly effective RSI technique.
Bullish Swing Rejection:
- RSI falls below 30
- RSI rises above 30
- RSI pulls back but stays above 30
- RSI breaks previous high → Buy signal
Bearish Swing Rejection:
- RSI rises above 70
- RSI falls below 70
- RSI retraces but stays below 70
- RSI breaks previous low → Sell signal
Best RSI Settings for Forex
The default RSI setting is 14 periods, which works well in most cases. However, traders can adjust it depending on their trading style:
- Scalping (M1–M5) → RSI 7 or 9 (more sensitive)
- Day Trading (M15–H1) → RSI 14 (balanced)
- Swing Trading (H4–D1) → RSI 21 (less noise)
👉 Shorter periods = more signals but less reliable.
👉 Longer periods = fewer signals but more accurate.
: Complete Guide for Forex Traders 7")
Combining RSI with Other Indicators
RSI becomes much more powerful when used alongside other tools.
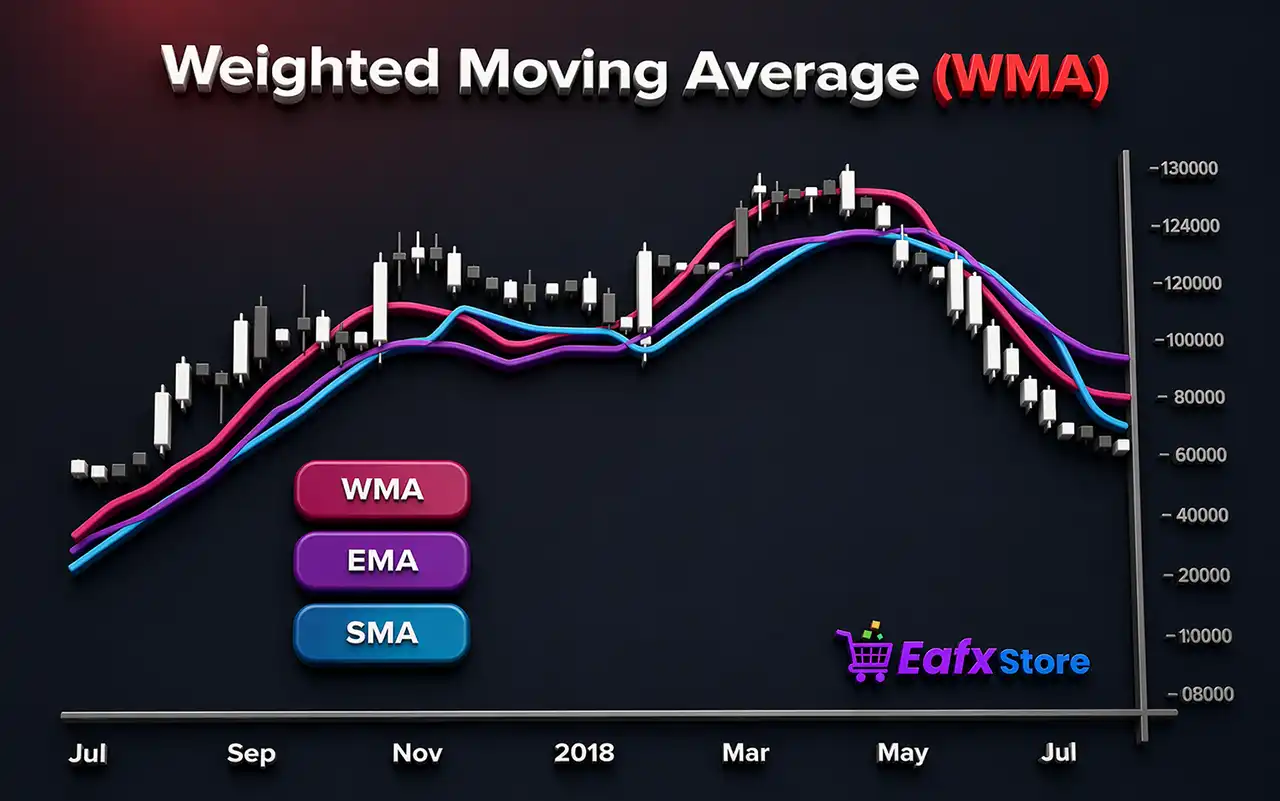
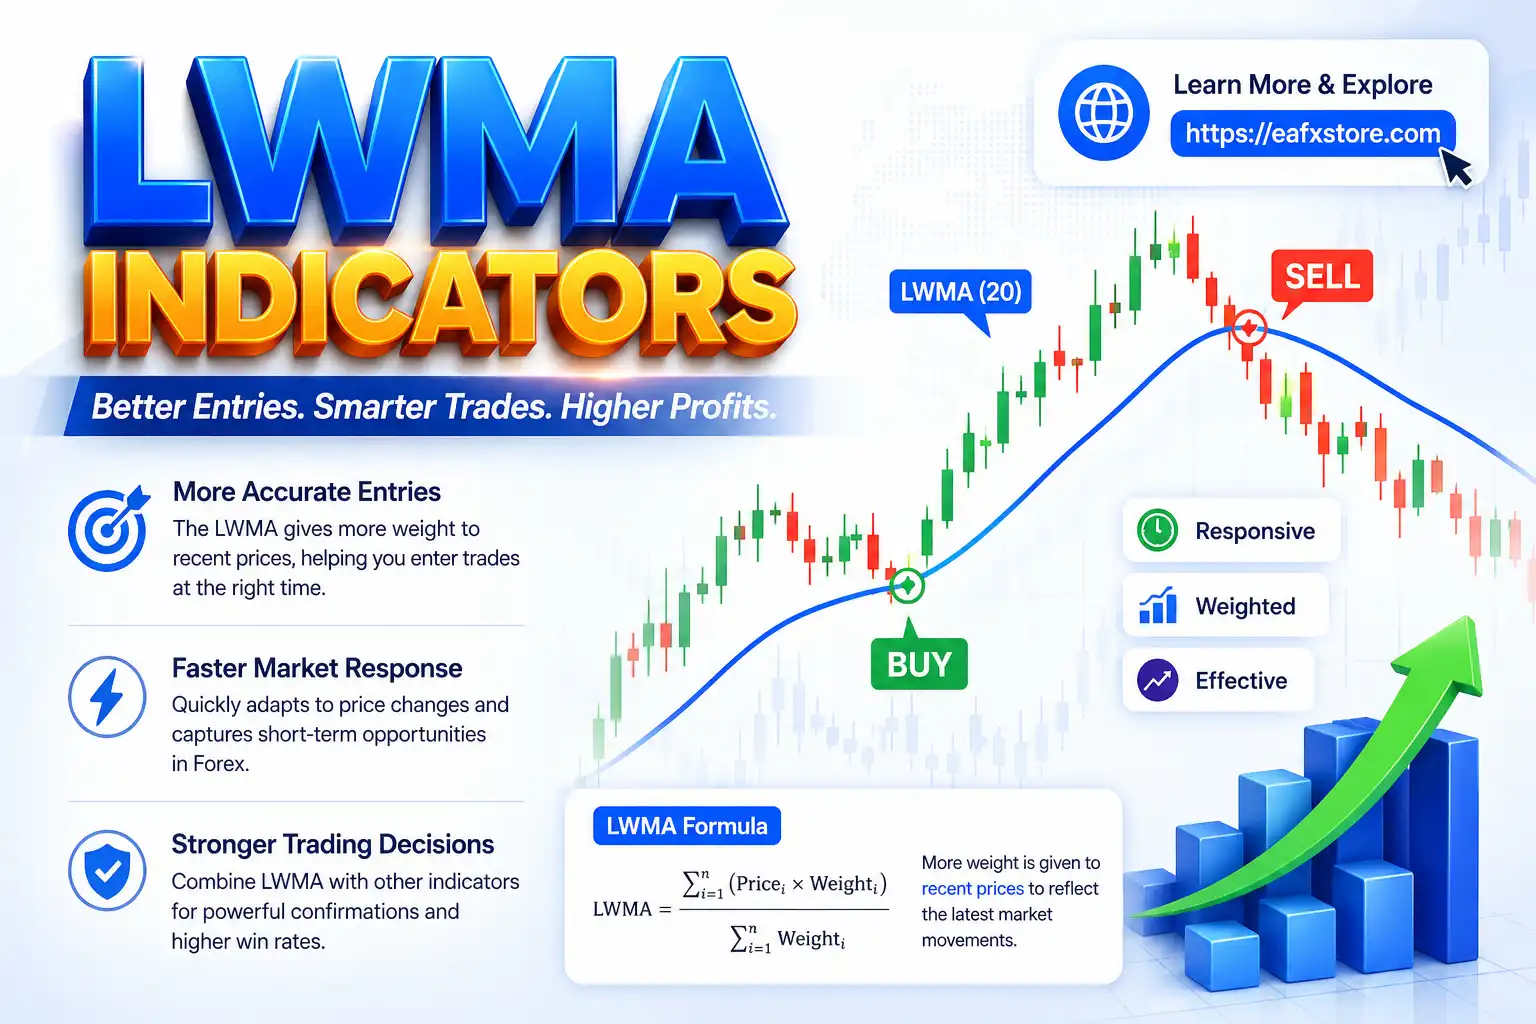
1. RSI + Moving Averages
- Use Moving Averages (MA) to identify trend direction.
- Use RSI to time entries.
Example:
- Uptrend + RSI oversold → Buy opportunity.
2. RSI + Support and Resistance
- Enter trades when RSI signals align with key price levels
Example:
- Price at support + RSI below 30 → Strong buy setup
3. RSI + MACD
- RSI identifies overbought/oversold
- MACD confirms momentum
This combination helps reduce false signals.
: Complete Guide for Forex Traders 8")
Common RSI Mistakes to Avoid
Even though RSI is simple, many traders misuse it.
1. Trading Against Strong Trends
RSI can stay overbought/oversold for a long time in trending markets.
👉 Solution: Always check the trend first.
2. Ignoring Market Context
RSI signals are not standalone. Economic news, volatility, and liquidity all matter.
3. Using RSI Alone
Relying only on RSI increases risk.
👉 Combine it with price action and other indicators.
4. Overtrading
Too many signals can lead to unnecessary trades.
👉 Focus on high-probability setups.
Advanced RSI Techniques
1. RSI Zones Adjustment
Instead of 70/30, adjust levels based on market conditions:
- Strong uptrend → 80/40
- Strong downtrend → 60/20
This helps filter false signals.
2. Multiple Timeframe Analysis
Use RSI across different timeframes:
- Higher timeframe → Identify trend
- Lower timeframe → Entry timing
Example:
- Daily RSI bullish
- H1 RSI oversold → Buy setup
3. RSI Trendline Breaks
You can draw trendlines directly on RSI.
- Break of RSI trendline often signals momentum shift before price reacts.
: Complete Guide for Forex Traders 9")
RSI Trading Strategy Example
Strategy: Trend + Pullback
Step 1: Identify trend using Moving Average (MA).
Step 2: Wait for RSI to drop below 30 (in uptrend).
Step 3: Confirm with support level.
Step 4: Enter buy trade.
Step 5: Set Stop Loss (SL) below support.
Step 6: Take Profit (TP) at resistance.
This strategy combines trend-following with momentum timing.
Pros and Cons of RSI
1. Advantages:
- Easy to understand and use.
- Works across all timeframes.
- Helps identify reversals and momentum.
- Suitable for beginners and professionals.
2. Disadvantages:
- Can give false signals in strong trends.
- Lagging indicator (based on past data).
- Needs confirmation from other tools.
Final Thoughts
The Relative Strength Index (RSI) is one of the most versatile and widely used indicators in Forex trading. Its ability to identify overbought and oversold conditions, detect divergence and confirm trends makes it an essential tool in any trader’s toolkit.
However, like any indicator, RSI is not perfect. The key to success lies in combining RSI with other technical tools, understanding market context, and practicing proper risk management.
If used correctly, RSI can help you:
- Improve entry and exit timing.
- Reduce emotional trading.
- Increase overall trading consistency.
Conclusion
Mastering RSI is not about memorizing levels—it’s about understanding market behavior. With practice and discipline, RSI can become a powerful ally in your Forex trading journey.
Start simple, test strategies on a demo account and gradually refine your approach. Over time, you’ll develop the confidence and skill needed to use RSI effectively in real market conditions.