
Few names in technical analysis carry as much mystery as W.D. Gann. More than a century after he began trading, his angles, squares and cycles still appear on MetaTrader, TradingView and countless trading forums. Some traders see his methods as a powerful way to forecast turning points; others see them as overcomplicated. Either way, understanding Gann helps you read a large part of trading literature and gives you a unique way to think about the relationship between price and time.
This guide explains who Gann was, his core tools, how to apply them to Forex charts and where their limits lie.
Who Was W.D. Gann?
William Delbert Gann (1878–1955) was an American trader and author who traded stocks and commodities in the early twentieth century. He wrote several books and courses on market analysis, including Truth of the Stock Tape and How to Make Profits in Commodities.
Gann believed that markets move in measurable patterns of price and time, influenced by geometry, natural cycles and mathematical relationships. Many stories about his trading record and forecasts circulate online, but not all of them can be independently verified, so it is best to judge his tools on how they perform on your own charts.
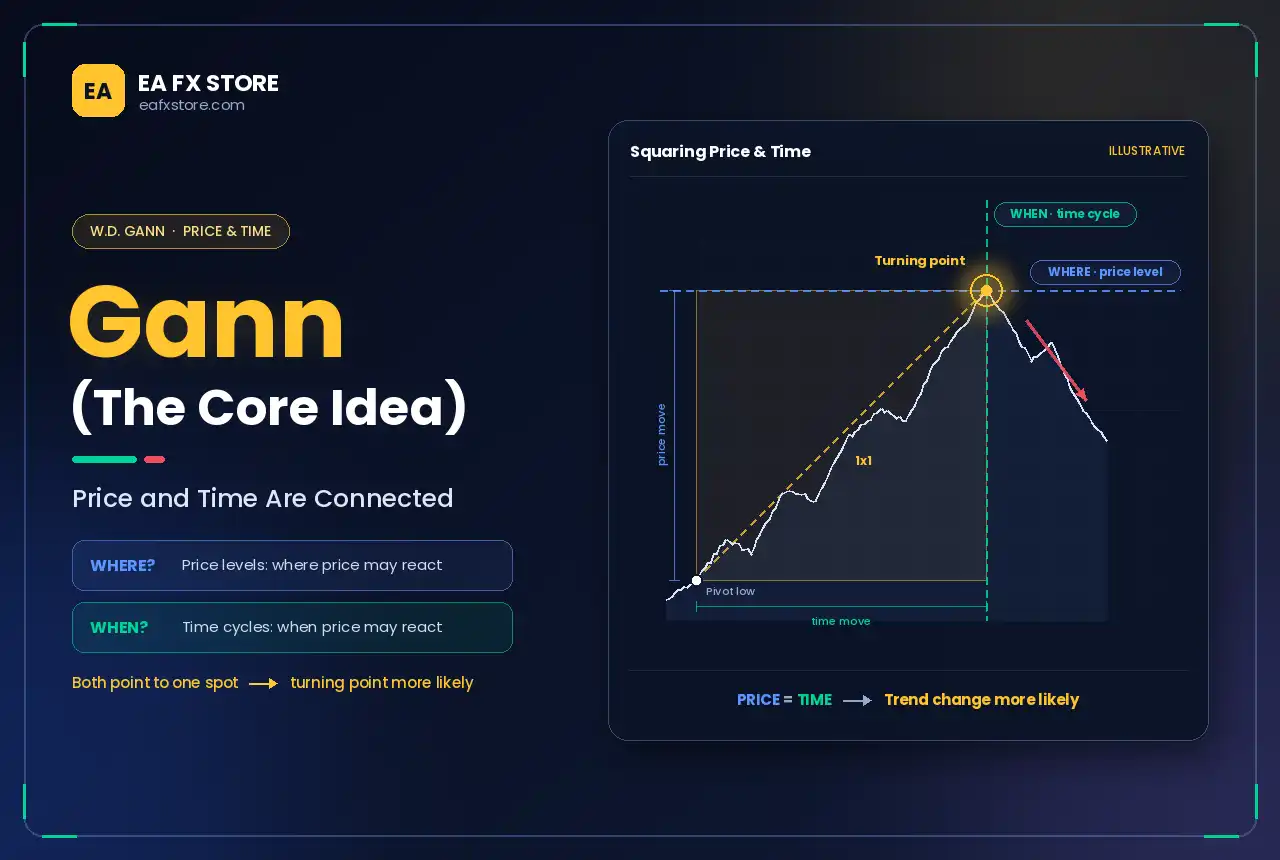
The Core Idea: Price and Time Are Connected
Most technical tools focus on price alone. Gann’s central idea was that price and time are linked, and that when a move in price is “balanced” with a move in time, a change in trend becomes more likely. He called this balance squaring price and time.
In practice, Gann traders ask two questions:
- Where is price likely to react? (price levels)
- When is price likely to react? (time cycles)
When both answers point to the same area on the chart, the probability of a turning point increases.
Gann Angles and the Gann Fan
Gann angles are diagonal lines drawn from a significant high or low. Each angle represents a fixed rate of price movement per unit of time.
| Angle | Price units per time unit | Meaning |
| 1x1 | 1 price unit per 1 time unit | The balance line, often described as 45° |
| 2x1 | 2 price units per 1 time unit | Strong, steep trend |
| 1x2 | 1 price unit per 2 time units | Weak, slow trend |
| 4x1 / 1x4 | 4:1 and 1:4 | Very strong and very weak trends |
| 8x1 / 1x8 | 8:1 and 1:8 | Extreme angles |
Drawing several angles from the same point creates a Gann Fan. The general rules are:
- While price stays above the 1x1 angle in an uptrend, the trend is considered strong and Bullish.
- A break below the 1x1 suggests the trend is weakening, and price may move to the next angle down, such as the 1x2.
- The reverse applies in a Bearish trend.
The scaling problem
Gann angles only work if the chart is scaled correctly, because the “45°” line depends on how many pips you assign to each bar. On most platforms, zooming changes the visual angle but not the mathematical one. Choose a fixed scale, for example 10 pips per hourly bar on EUR/USD, and use it consistently. The Gann Fan tools on MetaTrader and TradingView let you set this ratio.
Gann’s Eighths: Retracement Levels
Gann divided price ranges into eighths and thirds to find support and resistance:
- 12.5%, 25%, 37.5%, 50%, 62.5%, 75%, 87.5% and 100%
- 33.3% and 66.7%
He considered the 50% level the most important. After a strong move, a retracement to half of the range is a common area for price to pause or reverse. These levels are similar in spirit to Fibonacci retracements and are often used alongside them.
The Square of Nine
The Square of Nine is a spiral of numbers starting with 1 at the centre and winding outward. Numbers that fall on the same angle of the spiral, such as the cardinal cross (0°, 90°, 180°, 270°), are believed to be natural support and resistance levels.
A common way to calculate Square of Nine levels uses square roots:
- Take the square root of a significant price, such as a major high or low.
- Add or subtract a fraction that represents the rotation: 0.25 for 45°, 0.5 for 90°, 1 for 180° and 2 for 360°.
- Square the result to get the projected level.
Example (USD/JPY): a major low at 150.00 has a square root of about 12.247.
- 45° up: (12.247 + 0.25)² ≈ 156.18
- 90° up: (12.247 + 0.5)² ≈ 162.50
- 90° down: (12.247 − 0.5)² ≈ 138.00
For pairs quoted with four or five decimals, such as EUR/USD, traders usually convert the price into a whole number first, for example 1.0850 becomes 10850, then convert the result back. The choice of conversion changes the output, which is one reason Square of Nine results vary between traders.
Gann Time Cycles
Gann placed great emphasis on time. He watched for trend changes at specific intervals from important highs and lows, including:
- Calendar-based cycles: 30, 45, 60, 90, 120, 180 and 360 days.
- Anniversary dates: turning points one year after a major high or low.
- Seasonal dates: around the equinoxes and solstices.
- Bar counts: the same numbers applied to bars on intraday charts.
When a time cycle falls near a price level from the Gann Fan, eighths or Square of Nine, Gann traders treat that area as a possible turning point.
Applying Gann in Forex Today
Gann developed his methods for stocks and commodities, but Forex traders adapt them in several ways:
- Start from a major swing point on the daily or weekly chart.
- Draw eighths of the main range and note the 50% level.
- Add a Gann Fan from the same swing using a fixed scale.
- Project time cycles forward from the swing.
- Look for confluence with other methods, such as the Point of Control, the Value Area High or Value Area Low, or a harmonic Potential Reversal Zone.
- Wait for confirmation, such as a rejection candle or a Market Structure Shift, before entering.
Gann levels also combine naturally with session timing. A Gann time cycle that lands during the London or New York Kill Zones may carry more weight than one in quiet hours.
Limitations of Gann Trading
- Subjectivity. Different starting points, scales and conversions produce different levels.
- Hindsight bias. With many angles, levels and cycles on a chart, some will always appear to line up after the fact.
- Limited testing. Many Gann claims have not been tested rigorously on modern markets.
- Complexity. Beginners can spend more time drawing lines than managing risk.
Treat Gann tools as a way to find potential reaction zones, not as precise predictions. Backtest any Gann-based rule on your chosen pairs before trading it live.
Frequently Asked Questions
❓ What is Gann trading?
It is a technical analysis approach based on the work of W.D. Gann, using angles, geometric levels and time cycles to find potential support, resistance and turning points.
❓ What is the Gann 1x1 angle?
It is the line that rises or falls one price unit per time unit. Gann considered it the balance line between price and time.
❓ How does the Square of Nine work?
It projects support and resistance levels by rotating a price around a numerical spiral, usually by adding or subtracting fractions of the price’s square root.
❓ Does Gann work in Forex?
Some traders use Gann tools successfully in Forex, but results depend heavily on scaling, starting points and confirmation. Always test before trading.
Conclusion
Gann’s work offers a distinctive way to analyse markets by combining price levels with time. His angles, eighths, Square of Nine and time cycles can highlight areas where a trend may accelerate, pause or reverse. Used with a consistent method, confirmation from price action and sound risk management, Gann tools can add a valuable time dimension to your Forex analysis.
Risk warning: Trading Forex and CFDs on margin carries a high level of risk and may not be suitable for all investors. This article is for educational purposes only and is not investment advice.