
Machine learning is no longer only for hedge funds. Today, retail traders can find machine learning indicators on TradingView, MetaTrader and Python libraries with just a few clicks. One of the most popular of these methods is KNN, short for K-Nearest Neighbors. It is simple enough to understand without a data science degree, yet flexible enough to power some widely used trading indicators.
This guide explains what KNN is, how it works on a price chart, how to build and test a KNN model, and the pitfalls every trader should know before trusting it.
What is KNN (K-Nearest Neighbors)?
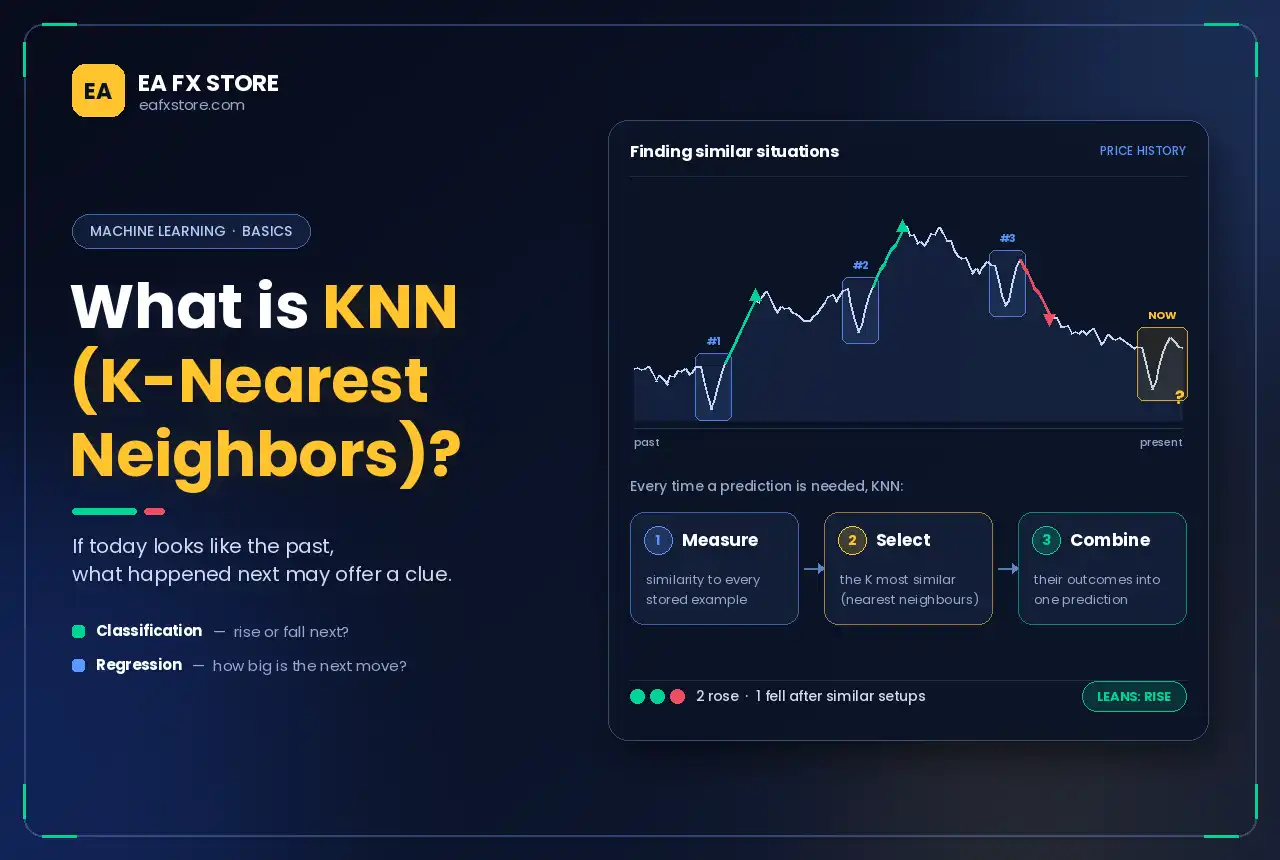
K-Nearest Neighbors (KNN) is a machine learning algorithm that makes predictions by looking for past situations that are most similar to the present. The idea is intuitive: if today’s market conditions look like conditions from the past, what happened next in those past cases may offer a clue about what happens next now.
KNN does not build a complex model in advance. It stores historical examples and, whenever a new prediction is needed, it:
- Measures how similar the current situation is to every stored example.
- Selects the K most similar examples, called the nearest neighbours.
- Combines their outcomes to make a prediction.
In trading, that prediction is usually a classification, such as “the next bars are more likely to rise or fall”, or a regression, such as an estimate of the next move’s size.
How KNN Works on a Price Chart
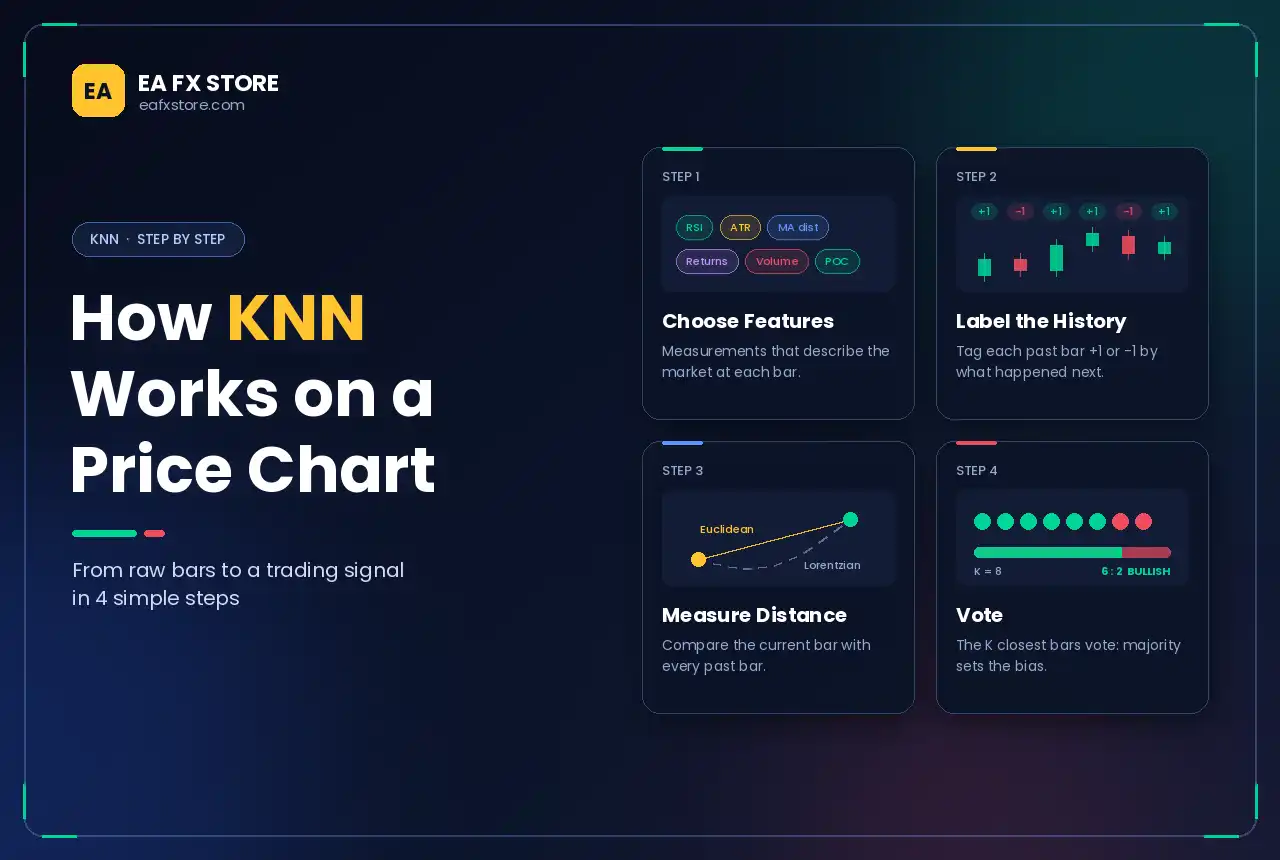
Step 1: Choose features
Features are the measurements that describe the market at each bar. Common choices include:
- Momentum indicators, such as RSI or the rate of change.
- Volatility measures, such as ATR.
- Trend measures, such as the distance from a moving average.
- Returns over the last few bars.
- Volume data, such as tick volume relative to its average.
- Position relative to Volume Profile levels, such as distance from the Point of Control.
Step 2: Label the history
For every past bar, record what happened next. For example, label the bar +1 if price was higher four bars later and -1 if it was lower. This label is what KNN will try to predict.
Step 3: Measure distance
KNN compares the current bar’s features with each historical bar’s features using a distance metric. The most common is Euclidean distance, the straight-line distance between two points. Some trading indicators use alternatives, such as Lorentzian distance, which reduces the influence of extreme outliers that often appear around news events.
Step 4: Vote
The K closest historical bars “vote”. If K = 8 and six neighbours were followed by a rise while two were followed by a fall, the model leans Bullish. If the votes are evenly split, the signal is Neutral.
A Simple Example
Suppose you describe each hourly EUR/USD bar with two features: RSI and the percentage distance from the 50-period moving average. The current bar has an RSI of 32 and sits 0.4% below the moving average.
KNN searches the history and finds the eight bars with the most similar RSI and distance values. If six of those were followed by higher prices four hours later, the model outputs a bullish signal with a 75% vote. That does not mean a 75% chance of profit; it only reflects how the most similar past cases behaved.
Choosing K
The value of K has a big effect on results:
- Small K (1 to 3): very sensitive to individual examples, producing noisy signals that often change.
- Large K (50 or more): smooth signals, but the neighbours may no longer be truly similar, so the model reacts slowly.
- Odd K values avoid ties in simple up/down voting.
Most traders test several values of K and choose one that performs consistently across different periods, not just the best-looking one on a single backtest.
Why Normalisation Matters
KNN depends entirely on distance, so features must be on comparable scales. RSI ranges from 0 to 100, while a percentage return might range from -1 to +1. Without normalisation, RSI would dominate the distance calculation. Rescale each feature to a common range, such as 0 to 1, or standardise it by subtracting the mean and dividing by the standard deviation.
KNN Indicators on Trading Platforms
On TradingView, several community indicators apply KNN-style classification to price data, often plotting coloured signals or a probability line on the chart. On MetaTrader, KNN appears in some custom indicators and Expert Advisors. Python traders can build their own models with libraries such as scikit-learn.
Before using any ready-made KNN indicator, check how it is built:
- Does it repaint? Some indicators change past signals after new data arrives, making them look far better in hindsight than they were in real time.
- What features and labels does it use? Understand what the model is actually predicting.
- How much history does it use? Too little data gives unreliable neighbours.
Combining KNN With Market Context
KNN works best as a filter rather than a standalone system. For example:
- Only take KNN bullish signals when price is near the Value Area Low or inside a bullish Potential Reversal Zone.
- Ignore signals in the middle of a High Volume Node, where price often chops.
- Require a Market Structure Shift in the same direction before entering.
This keeps the model’s statistical edge while grounding entries in levels that make sense on the chart.
Risks and Limitations
- Overfitting. Tuning K, features and labels until the backtest looks perfect usually produces a model that fails on new data.
- Look-ahead bias. Accidentally using information that would not have been available at the time of the signal makes results unrealistically good.
- Changing market regimes. Patterns from a quiet, ranging period may not apply during a strong trend or a crisis.
- Computational cost. KNN compares the current bar with every stored example, which can slow down indicators with long histories.
- Broker data differences. Tick volume and prices differ slightly between brokers, so a model trained on one feed may behave differently on another.
How to Test a KNN Strategy
- Split your data into a training period and an out-of-sample test period.
- Use walk-forward testing, re-training the model on a rolling window and testing on the following period.
- Include costs such as spreads, commissions and swaps.
- Compare with a simple benchmark, such as a moving average strategy, to confirm KNN adds value.
- Forward test on a demo account before risking real money.
Frequently Asked Questions
What is KNN in trading?
KNN, or K-Nearest Neighbors, is a machine learning method that predicts market direction by comparing current conditions with the most similar situations in the past.
Is KNN good for Forex?
It can be a useful filter, but its results depend heavily on feature choice, normalisation and testing. It is not a guaranteed edge.
What is the best K value for trading?
There is no universal best value. Test a range and choose one that is stable across different market periods.
Do KNN indicators repaint?
Some do. Always check whether historical signals change after new bars form before trusting a backtest.
Conclusion
KNN brings a simple but powerful idea to trading: learn from the past situations that most resemble today. With carefully chosen features, proper normalisation and honest out-of-sample testing, a KNN model can help filter trades and add a statistical view to your analysis. Combine it with market structure and Volume Profile levels, stay alert to overfitting, and treat every signal as a probability, not a promise.
Risk warning: Trading Forex and CFDs on margin carries a high level of risk and may not be suitable for all investors. Machine learning models do not guarantee profits, and past performance does not predict future results. This article is for educational purposes only and is not investment advice.