
A price chart shows you what has already happened. The Depth of Market (DOM) shows you what traders are preparing to do next. By displaying the buy and sell orders waiting at each price level, the DOM gives you a live view of supply and demand just above and below the current price. For short-term traders, it can be the difference between entering at a good price and chasing the market.
This guide explains what the DOM is, how to read it, how it works in Forex compared with futures, and how to combine it with Volume Profile and price action.
What is Depth of Market?
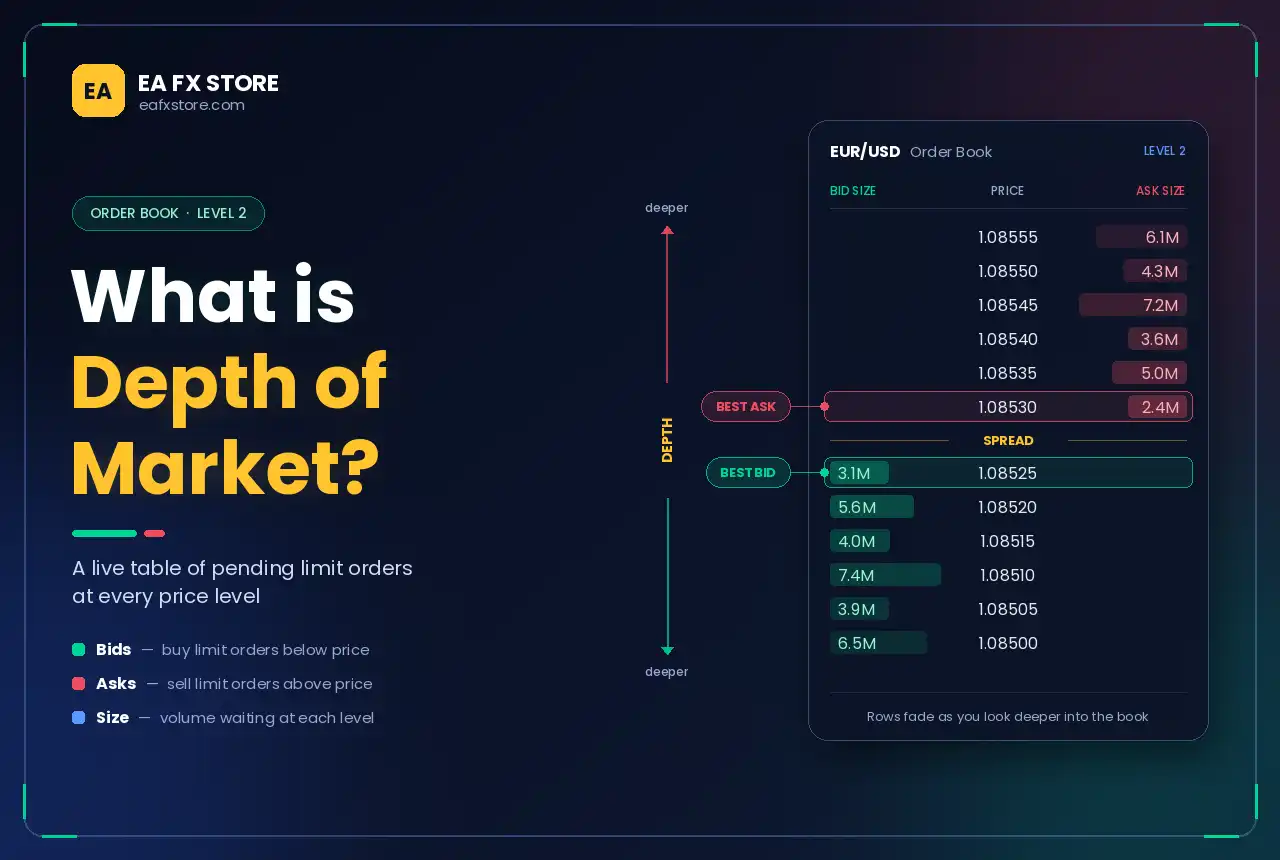
Depth of Market (DOM), also called the order book or Level 2 data, is a table that lists the pending limit orders at each price level for a trading instrument.
- Bids are buy limit orders waiting below the current price.
- Asks (or offers) are sell limit orders waiting above the current price.
- Size shows how much volume is waiting at each price.
The best bid and best ask sit closest to the current price, and the difference between them is the spread. The further you move from the current price, the deeper into the order book you are looking, which is where the name “depth” comes from.
How to Read a DOM
A typical DOM ladder has three columns: bid size on one side, price in the middle, and ask size on the other. Here is a simplified example for EUR/USD:
| Bid size | Price | Ask size |
| 1.08540 | 3.5 lots | |
| 1.08530 | 8.0 lots | |
| 1.08520 | 2.1 lots | |
| 1.8 lots | 1.08510 | |
| 6.5 lots | 1.08500 | |
| 12.0 lots | 1.08490 |
In this example, the best ask is 1.08520 and the best bid is 1.08510, a spread of one pip. There is noticeably larger size waiting at 1.08530 on the sell side and at 1.08490 on the buy side. These clusters are potential short-term resistance and support.
The numbers are illustrative only. Real DOM data changes many times per second.
Market Orders vs Limit Orders
To read the DOM properly, you need to understand how orders interact:
- Limit orders add liquidity. They sit in the book and wait to be filled.
- Market orders remove liquidity. They execute immediately against the best available limit orders.
When a large market buy order arrives, it consumes the asks at the best price, then the next price, and so on. If the ask side is thin, price can jump several levels quickly. If the ask side is thick, the same order may barely move the price. This is why the DOM helps explain sudden spikes and stalls.
What Traders Look For in the DOM
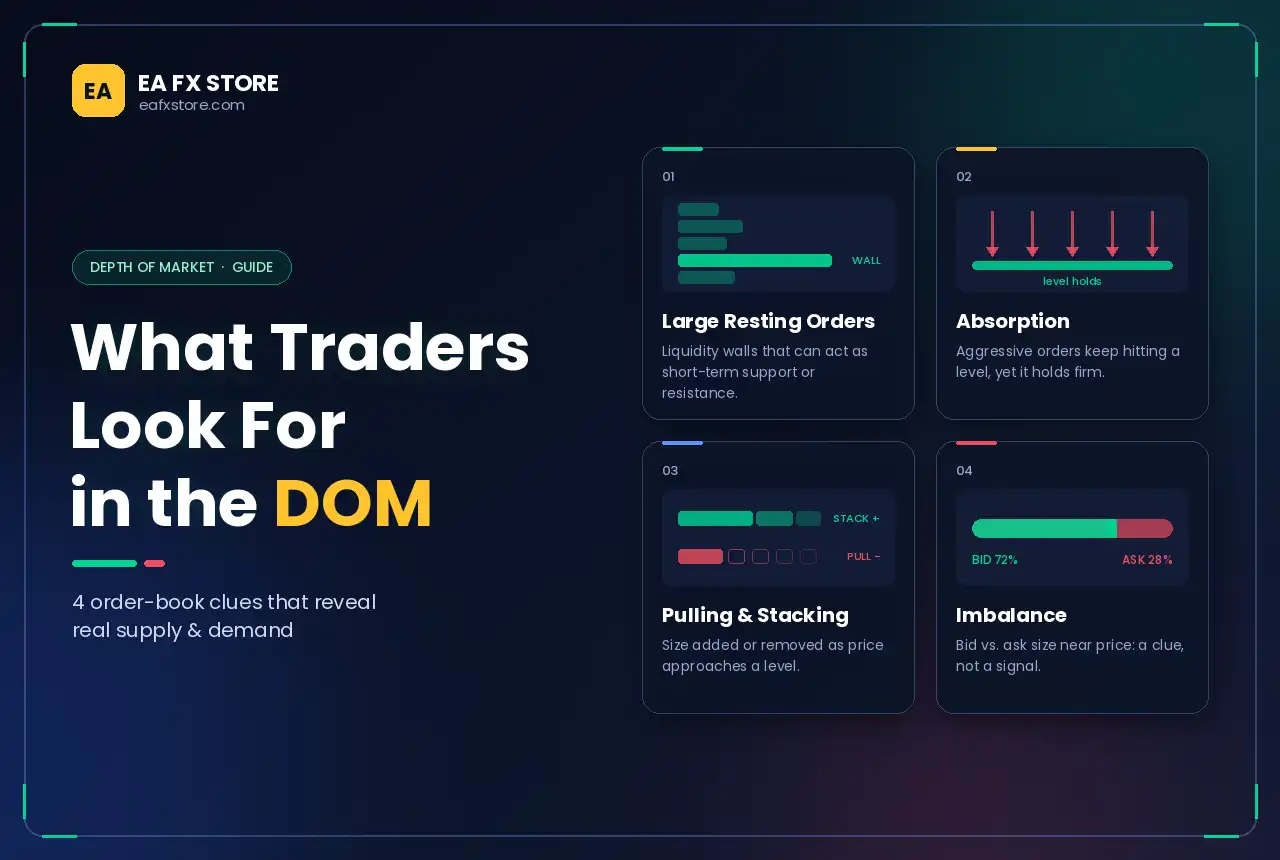
Large resting orders
Unusually large bids or asks, sometimes called liquidity walls, can act as short-term support or resistance. Price often slows as it approaches them.
Absorption
Absorption happens when aggressive market orders keep hitting a level, but the resting orders there are not exhausted and price does not move through. For example, heavy selling into a large bid that holds firm suggests a strong buyer is absorbing supply, a possible bullish sign.
Pulling and stacking
Orders can be added or removed at any time. Stacking means size is being added to one side, while pulling means size disappears as price approaches. Watching how the book changes is often more useful than a single snapshot.
Imbalance
When total size on the bid side is much larger than on the ask side near the current price, buyers appear stronger, and vice versa. Treat this as a clue, not a signal, because displayed size can change instantly.
DOM in Forex vs Futures
This is where DOM analysis becomes tricky for Forex traders.
The spot currency market is decentralised, so there is no single, complete order book. When you open the Depth of Market window in MetaTrader 5, you usually see liquidity from your broker or its liquidity providers only, not the whole market. If you trade CFDs, some brokers show limited depth, and others show none at all.
Currency futures, such as the CME Euro FX contract (6E), are different. They trade on a central exchange, so their DOM shows the full exchange order book, together with real volume from actual trades. That is why many order-flow traders study the futures DOM even when they execute trades on spot or CFD platforms.
Limitations and Risks of DOM Trading
- Spoofing. Large orders can be placed to create a false impression of supply or demand, then cancelled before they are filled. Spoofing is illegal on regulated exchanges, but it still happens.
- Hidden and iceberg orders. Some large orders only display a small part of their true size, so the book does not show everything.
- Speed. The DOM changes constantly, and it can be hard to read in fast markets without practice.
- Incomplete data in Forex. A broker’s DOM reflects only part of global liquidity.
Because of these limits, the DOM works best as a timing tool combined with other analysis, not as a standalone strategy.
Combining DOM With Volume Profile
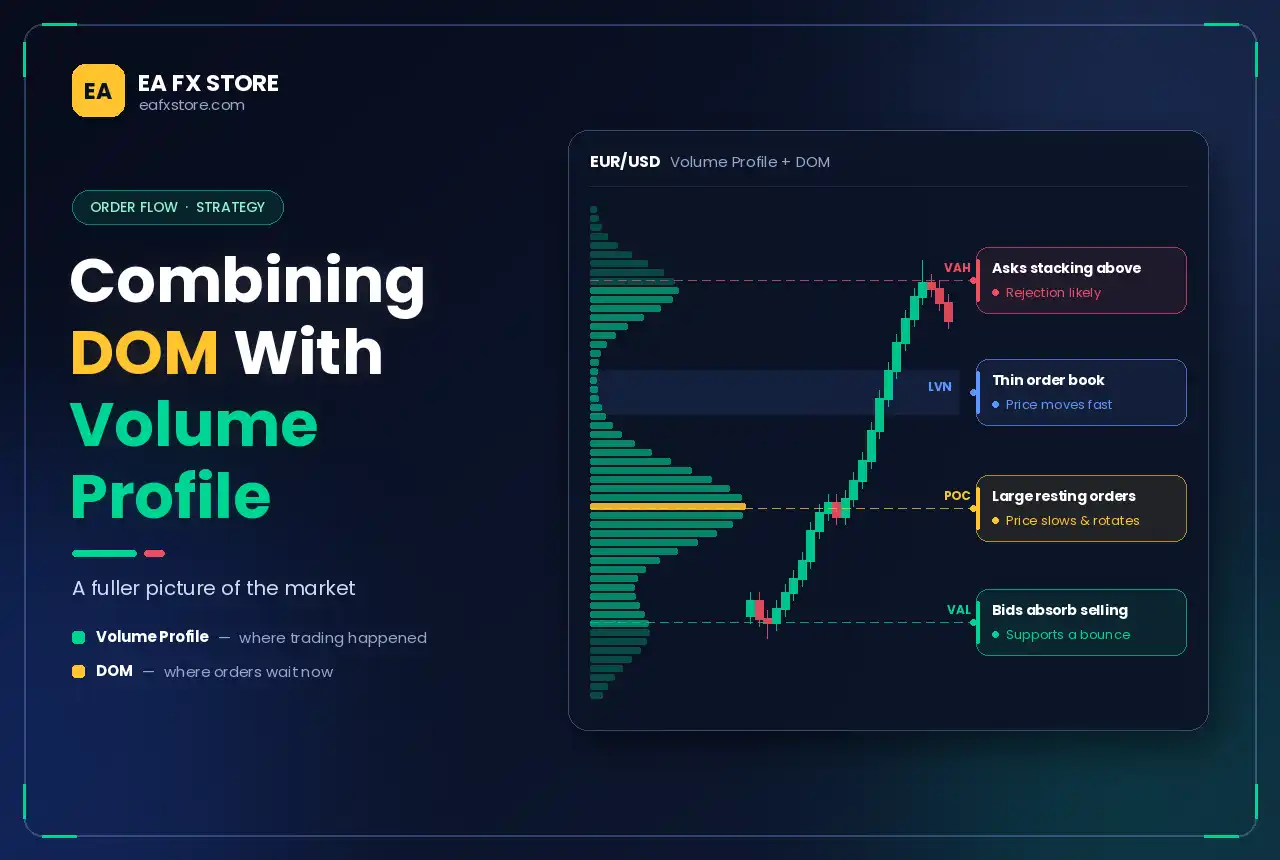
Volume Profile shows where trading has happened; the DOM shows where orders are waiting now. Together, they give a fuller picture:
- When price approaches the Value Area High and the DOM shows large asks stacking above, a rejection becomes more likely.
- When price reaches the Value Area Low and bids absorb aggressive selling, it supports a bounce.
- A thin order book in the area of a Low Volume Node helps explain why price can move quickly there.
- Large resting orders near the Point of Control or a High Volume Node support the idea that price will slow and rotate.
The DOM can also help confirm setups from other methods, such as a liquidity sweep in ICT trading or a reaction inside a Potential Reversal Zone.
How to Start Using the DOM
- Open the DOM on your platform. In MetaTrader 5, it is available through the Depth of Market option for the symbol, if your broker provides the data.
- Watch without trading. Spend time observing how the book behaves at the London and New York opens and around key levels.
- Focus on key levels. Only pay close attention to the DOM when price is near a level you already care about.
- Compare with time and sales. Check whether the orders that appear in the book actually get filled.
- Keep a journal of what you see before breakouts, rejections and reversals.
Frequently Asked Questions
What does DOM mean in trading?
DOM stands for Depth of Market, the order book that shows pending buy and sell orders at each price level.
Is DOM the same as Level 2 data?
Yes. Level 2 data and the order book are other names for Depth of Market information.
Does the DOM work in Forex?
Partly. Forex DOM usually shows only your broker’s or its liquidity providers’ orders, not the whole market. Currency futures DOM is more complete.
Can large orders in the DOM be fake?
They can be cancelled at any time, and some traders place orders they never intend to fill. Always confirm with actual trades and price action.
Conclusion
Depth of Market gives you a window into the orders waiting around the current price, helping you judge short-term support, resistance and momentum. In Forex, remember that the DOM usually shows only part of the market, and use futures data when you need a fuller view. Combine the DOM with Volume Profile levels and clear price action, and it becomes a powerful tool for timing entries and exits.
Risk warning: Trading Forex, futures and CFDs on margin carries a high level of risk and may not be suitable for all investors. This article is for educational purposes only and is not investment advice.