
Moving averages are among the most widely used tools in trading, but not all moving averages are built the same way. Open the Moving Average settings in MetaTrader and you will see four methods: Simple, Exponential, Smoothed and Linear Weighted. The last one, known as the LWMA, gives more importance to recent prices in a simple, transparent way, making it faster than a simple moving average while staying easy to understand.
This guide explains what LWMA is, how it is calculated, how it compares with other moving averages and how to use it in Forex trading and Expert Advisor (EA).
What is the LWMA?
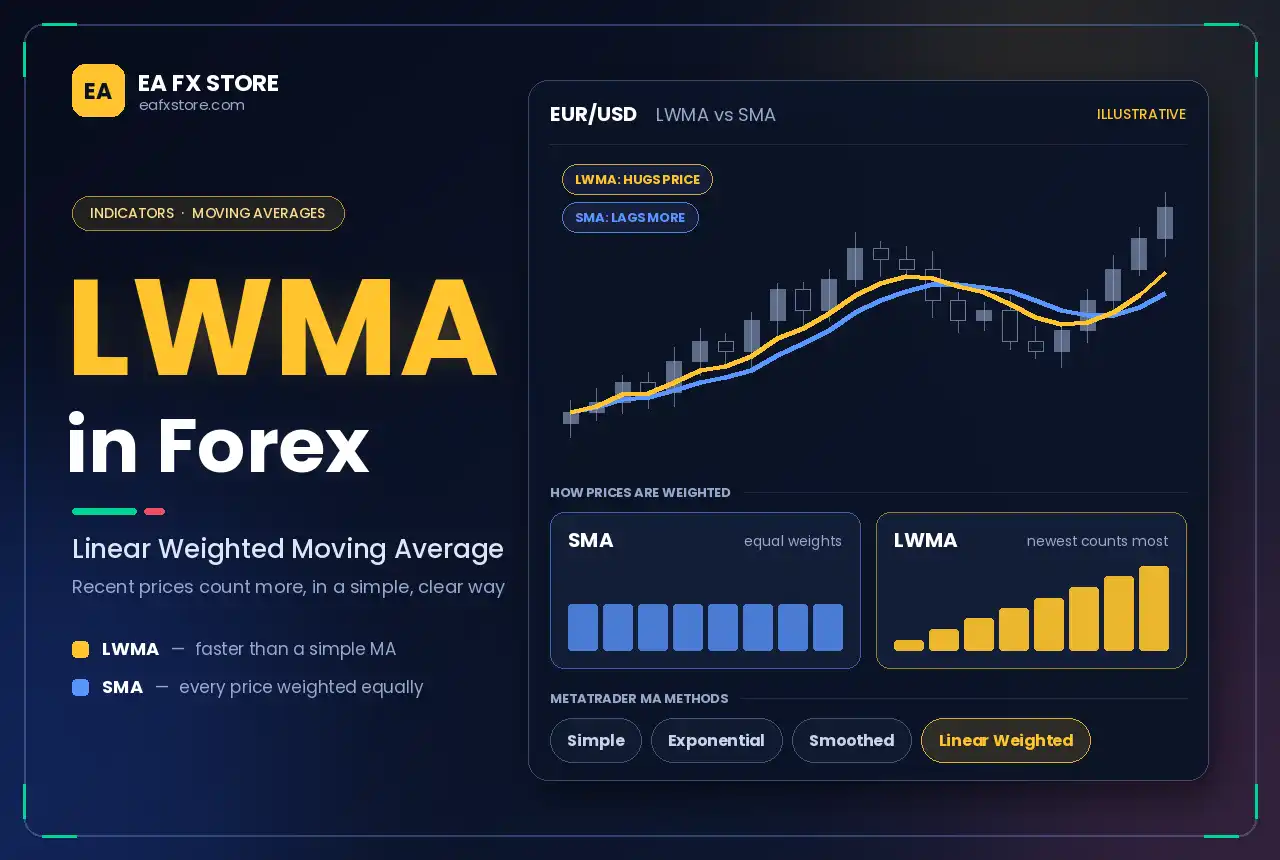
The Linear Weighted Moving Average (LWMA), also called the Weighted Moving Average (WMA), is a moving average that assigns a linearly increasing weight to each price in the period. The most recent price gets the highest weight, the one before it gets slightly less, and so on, down to the oldest price, which gets a weight of 1.
Because recent prices count more, the LWMA reacts faster to new price movements than a Simple Moving Average (SMA) of the same length.
How LWMA Is Calculated
For a period of N, the weights are N for the most recent price, N − 1 for the previous price, and so on down to 1 for the oldest price.
LWMA = (P1 × 1 + P2 × 2 + … + PN × N) ÷ (1 + 2 + … + N)
Here P1 is the oldest price and PN is the most recent. The sum of the weights equals N × (N + 1) ÷ 2.
Example: 5-period LWMA on EUR/USD closes
Bar | Close | Weight | Close × weight |
Oldest | 1.0800 | 1 | 1.0800 |
2 | 1.0810 | 2 | 2.1620 |
3 | 1.0805 | 3 | 3.2415 |
4 | 1.0820 | 4 | 4.3280 |
Most recent | 1.0830 | 5 | 5.4150 |
Total |
| 15 | 16.2265 |
LWMA = 16.2265 ÷ 15 ≈ 1.08177
The 5-period SMA of the same closes is 1.08130. The LWMA sits closer to the latest prices because the rising recent closes carry more weight.
LWMA vs SMA vs EMA vs SMMA
Moving average | How it weights prices | Speed | Typical use |
SMA (Simple) | Equal weight for all prices in the period | Slowest | Long-term trend, key levels such as the 200 SMA |
SMMA (Smoothed) | Very smooth, long memory of past prices | Slow | Filtering noise, used in indicators such as the Alligator |
EMA (Exponential) | Exponentially more weight on recent prices; older prices never fully drop out | Fast | Trend following, crossovers |
LWMA (Linear Weighted) | Linearly more weight on recent prices; only the last N prices count | Fast | Responsive trend and timing signals |
The LWMA and EMA are both fast, but they behave differently. The LWMA uses only the prices inside its period, so an old price spike drops out completely after N bars. The EMA keeps a small influence from all past prices. In practice, an LWMA often hugs price slightly more closely than an EMA of the same period.
How to Read the LWMA
Slope: a rising LWMA suggests a bullish trend; a falling one suggests a bearish trend; a flat LWMA suggests a range.
Price above or below: price above the LWMA favours buyers; price below it favours sellers.
Distance from price: a large gap between price and the LWMA can signal an overextended move that may pull back.
LWMA Trading Strategies
Trend filter
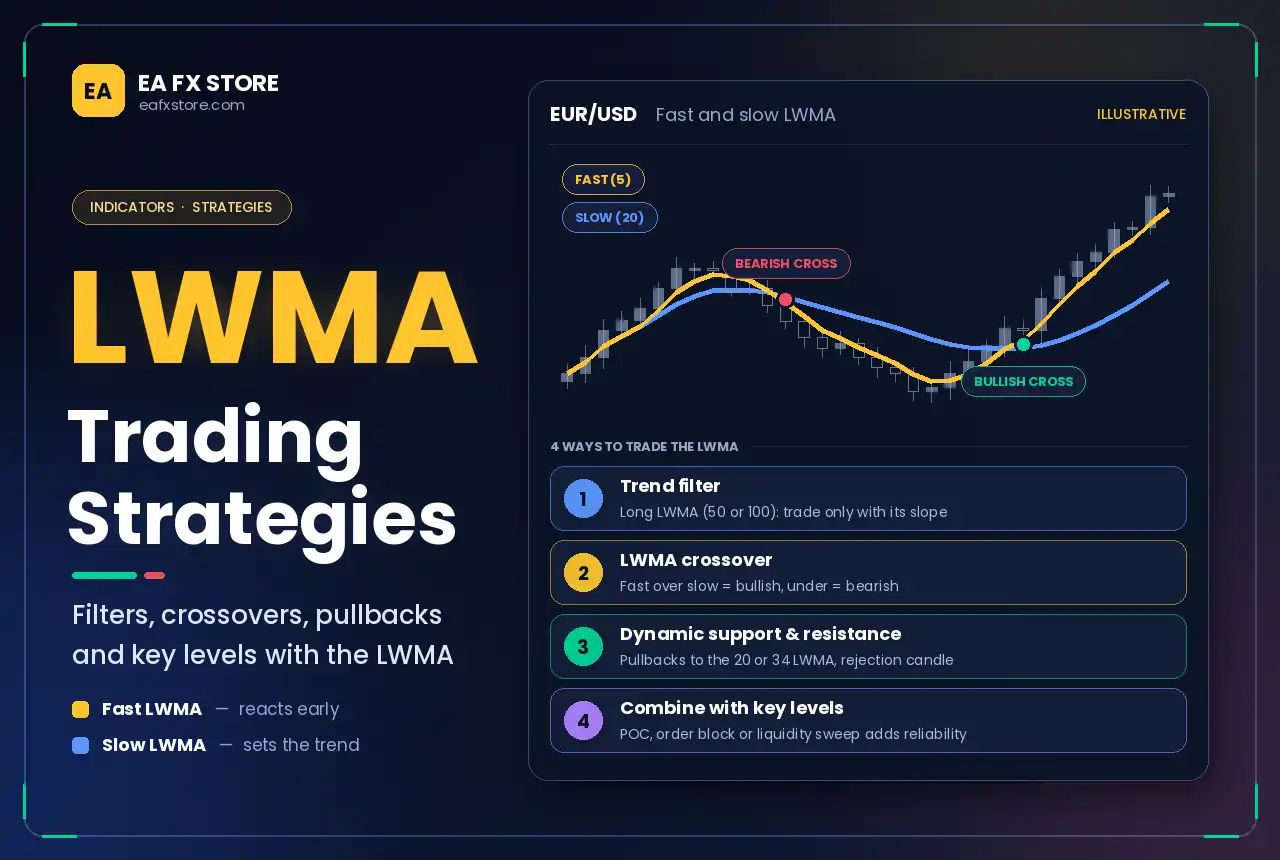
Use a longer LWMA, such as 50 or 100, to define the trend. Take only long trades when price is above a rising LWMA and only short trades when price is below a falling LWMA. Then use price action or another setup for entries.
LWMA crossover
A classic approach uses two LWMAs, for example 5 and 20 periods:
Bullish signal: the fast LWMA crosses above the slow LWMA.
Bearish signal: the fast LWMA crosses below the slow LWMA.
Because LWMA reacts quickly, crossovers come earlier than with SMAs, but they also produce more false signals in ranging markets. Adding a higher-timeframe trend filter improves reliability.
Dynamic support and resistance
In trending markets, price often pulls back to a medium-term LWMA, such as the 20 or 34, before continuing. Traders look for rejection candles near the line to enter in the trend direction, with a stop beyond the recent swing point.
Combining with key levels
An LWMA pullback that lines up with a strong level is more reliable. Examples include the Point of Control, an order block, or a zone just after a liquidity sweep.
Choosing LWMA Settings
Purpose | Common periods |
Short-term timing, scalping | 5 to 10 |
Swing trading, pullbacks | 20 to 34 |
Trend filter | 50 to 100 |
Long-term trend | 200 |
You can also choose which price the LWMA uses: close, typical price (high + low + close ÷ 3) or weighted close. The close is the most common choice.
On MetaTrader 4 and 5, add the standard Moving Average indicator and choose Linear Weighted as the MA method. On TradingView, the same calculation is available as WMA.
Using LWMA in Expert Advisors
LWMA is widely used in EAs for trend filters, crossover signals and exit rules. When building or testing one:
Read values from closed bars. The current bar’s LWMA changes until the candle closes.
Match the MA method exactly. An EA set to “Linear Weighted” will behave differently from one set to “Exponential”, even with the same period.
Add a range filter. Fast moving averages whipsaw in sideways markets, so combine LWMA with ADX, a volatility filter or a higher-timeframe trend.
Avoid over-optimising periods. Test settings across several pairs and market conditions.
Use realistic costs and apply sound risk management.
Combining LWMA With Other Tools
Market structure: confirm LWMA signals with higher highs and higher lows or a structure shift, as described in Smart Money Concepts.
Volume: crossovers on rising volume carry more weight, a principle explored in Volume Spread Analysis.
Other trend tools: some traders use LWMA as the middle line of channels or alongside indicators such as Heiken Ashi to confirm trend direction.
Advantages of LWMA
More responsive than an SMA of the same length.
Simple and transparent calculation.
Old data drops out completely after N bars, so distant price spikes do not linger.
Available on every major platform.
Limitations of LWMA
More whipsaws than slower averages in ranging markets.
Still lagging: like all moving averages, it is based on past prices.
Sensitive to settings: small changes in period can change signals noticeably.
Frequently Asked Questions
What does LWMA stand for?
LWMA stands for Linear Weighted Moving Average, a moving average that gives linearly more weight to recent prices.
Is LWMA the same as WMA?
Yes. Most platforms use WMA and LWMA for the same calculation. MetaTrader calls it “Linear Weighted”.
Is LWMA better than EMA?
Neither is better in every situation. LWMA uses only prices inside its period and often hugs price slightly more closely; EMA keeps some influence from older prices. Test both with your strategy.
What is the best LWMA period?
It depends on your timeframe and goal. Common choices are 5 to 10 for timing, 20 to 34 for pullbacks and 50 to 200 for trend filters.
Conclusion
The Linear Weighted Moving Average gives recent prices more importance in a simple, predictable way, making it faster and more responsive than a simple moving average. Use it to define trends, time crossovers and find dynamic support and resistance. Add a trend filter and key-level confirmation to reduce whipsaws, and always test your settings before trading live.
Risk warning: Trading Forex and CFDs on margin carries a high level of risk and may not be suitable for all investors. This article is for educational purposes only and is not investment advice.