
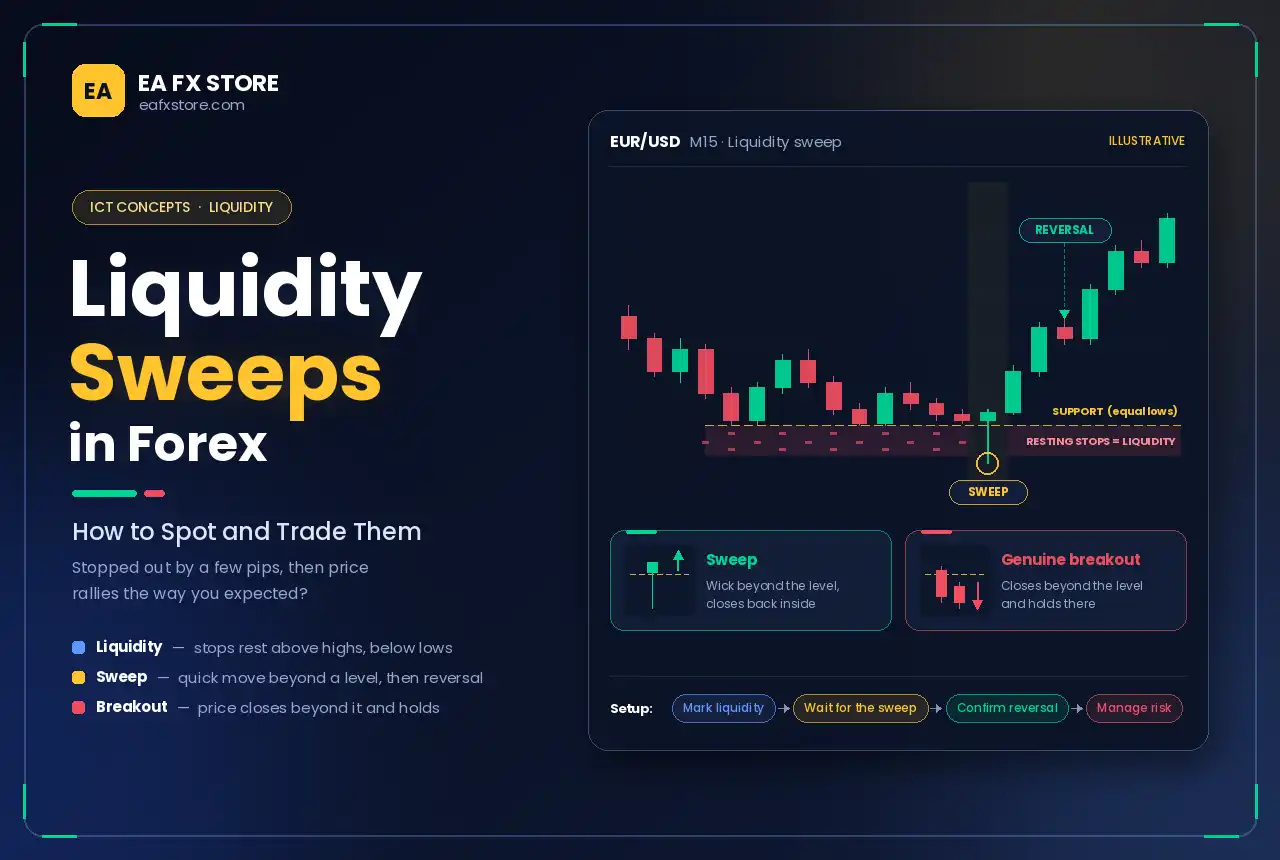
You place a stop-loss just below a clear support level. Price drops a few pips, hits your stop, and then rallies hard in the direction you originally expected. Most traders have experienced this frustrating pattern. It is often a liquidity sweep: a quick move beyond an obvious high or low that triggers resting orders before the market reverses.
This guide explains what liquidity is, where it collects, why sweeps happen, how to tell a sweep from a genuine breakout and how to build a disciplined trading setup around it.
What is Liquidity in Trading?
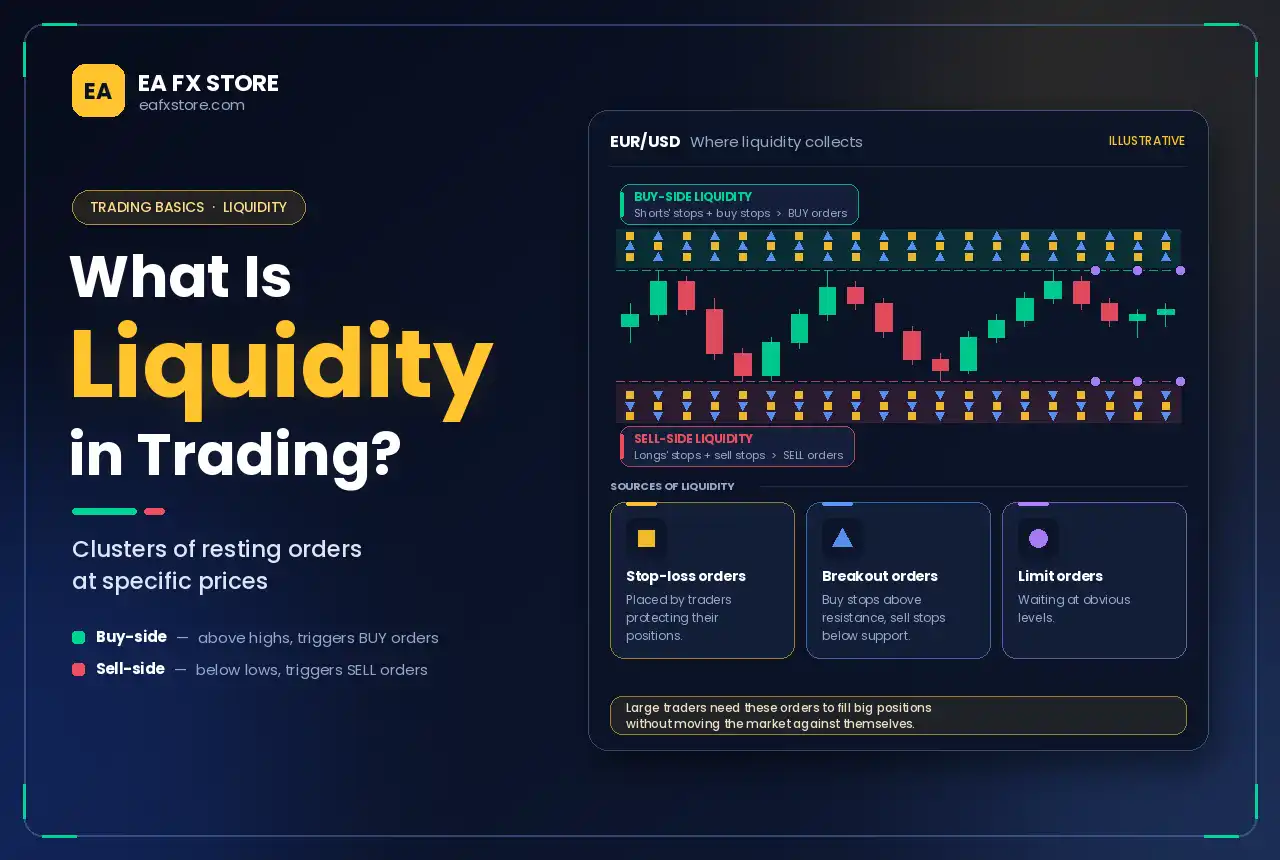
In this context, liquidity means clusters of resting orders at specific prices. Large traders need these orders to fill their positions without moving the market too much against themselves. The most important sources of liquidity are:
- Stop-loss orders placed by traders protecting their positions.
- Breakout orders, such as buy stops above resistance and sell stops below support.
- Limit orders waiting at obvious levels.
Liquidity is usually divided into two types:
- Buy-side liquidity sits above highs. It includes stop-losses of short sellers and buy-stop breakout orders. When triggered, these become buy orders.
- Sell-side liquidity sits below lows. It includes stop-losses of buyers and sell-stop breakout orders. When triggered, these become sell orders.
What is a Liquidity Sweep?
A liquidity sweep happens when price briefly moves beyond a high or low where liquidity is resting, triggers those orders, and then quickly reverses back. The move “sweeps” the orders off the book.
Why would a market do this? A large trader who wants to buy needs sellers. The stop-losses resting below a support level become market sell orders when triggered, providing exactly the liquidity that large buyer needs. Once the buying is complete, there is little selling left, and price can rise quickly.
Traders use several names for similar events, including liquidity grab, stop hunt and stop run. In ICT trading and Smart Money Concepts, the liquidity sweep is one of the most important building blocks. In Volume Spread Analysis, similar events are called an Upthrust above highs and a Shakeout below lows.
Where Liquidity Collects
Look for liquidity in places where many traders are likely to place stops or entries:
- Equal highs and equal lows, sometimes called double tops and double bottoms. They look like strong levels, so many stops gather beyond them.
- The previous day’s high and low, and the previous week’s high and low.
- The Asian session range, which is often swept during the London or New York Kill Zones.
- Round numbers, such as 1.1000 on EUR/USD or 150.00 on USD/JPY.
- Trendlines and channel boundaries, where traders place stops just beyond the line.
- Obvious swing highs and lows on the timeframe most traders watch.
The more obvious a level looks, the more liquidity is likely to be resting beyond it.
Liquidity Sweep vs Breakout
Not every move through a level is a sweep. Sometimes price breaks out and keeps going. The table below shows the main differences.
| Feature | Liquidity sweep | Genuine breakout |
| Close | Closes back inside the range | Closes and holds beyond the level |
| Speed of return | Returns within one or a few candles | Retests but stays beyond the level |
| Candle shape | Long wick beyond the level | Strong body beyond the level |
| Follow-through | Reverses with displacement | Continues in the breakout direction |
| Volume | Spike, then rejection | Rising volume with continuation |
The candle close is the most useful clue. Reading OHLC structure carefully, especially wick length and close position, helps you separate the two.
How to Confirm a Liquidity Sweep
A sweep alone is not an entry signal. Look for confirmation:
- Close back inside the range. Price must return to the side of the level it came from.
- Displacement. A strong, fast move away from the sweep shows that a large participant has stepped in.
- Market Structure Shift. On a lower timeframe, price breaks the most recent swing point in the new direction, creating a Market Structure Shift (MSS).
- Fair value gap or order block. The displacement often leaves an imbalance that offers a precise entry on the pullback.
- Volume reaction. A spike in tick volume on the sweep, followed by rejection, suggests orders were absorbed.
A Step-by-Step Liquidity Sweep Setup
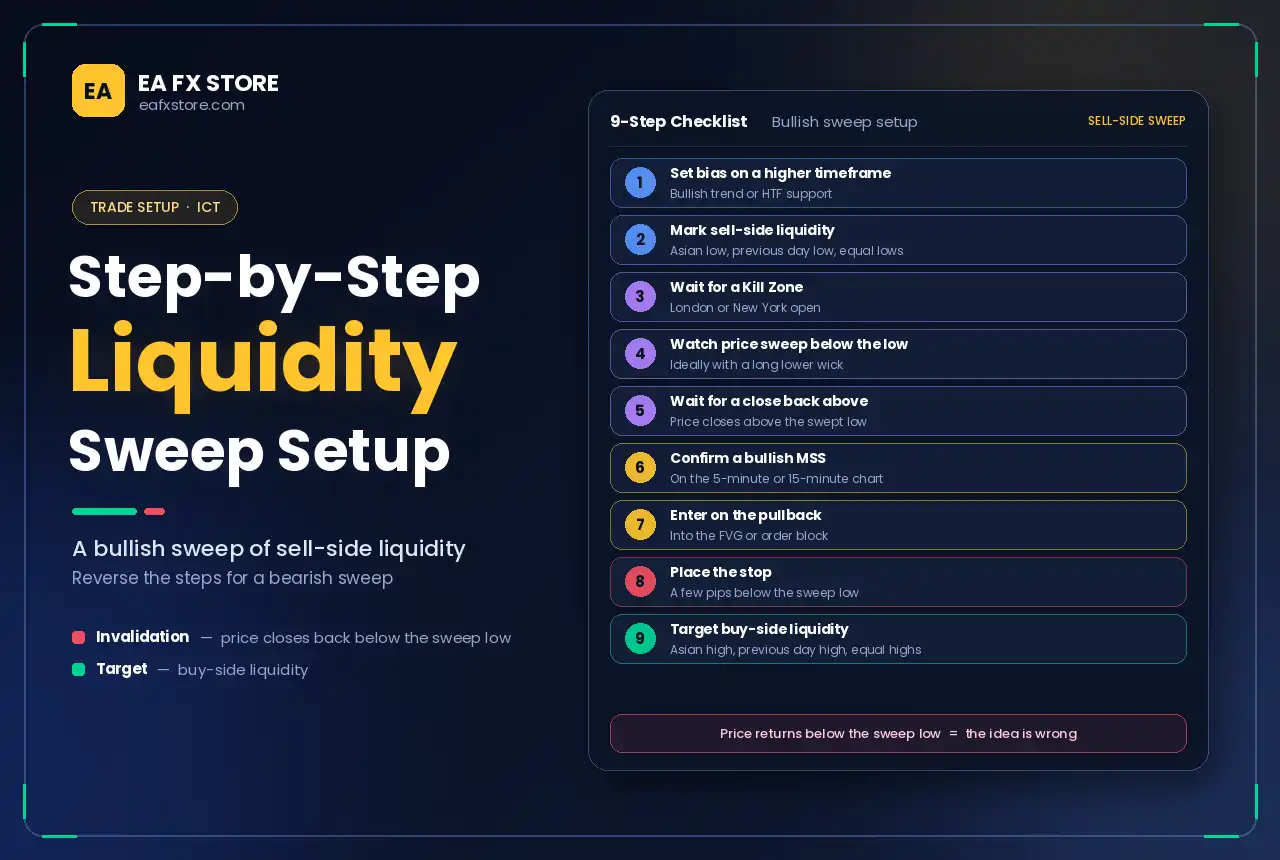
Here is a setup for a bullish sweep of sell-side liquidity. Reverse the steps for a bearish sweep.
- Set your bias on a higher timeframe. Look for a bullish trend or price at a higher-timeframe support level.
- Mark sell-side liquidity: the Asian low, the previous day’s low or equal lows.
- Wait for a Kill Zone, such as the London or New York open.
- Watch price sweep below the low, ideally with a long lower wick.
- Wait for price to close back above the swept low.
- Confirm a bullish MSS on a lower timeframe, such as the 5-minute or 15-minute chart.
- Enter on the pullback into the fair value gap or order block created by the displacement.
- Place the stop a few pips below the sweep low.
- Target buy-side liquidity, such as the Asian high, the previous day’s high or the next equal highs.
This setup offers a clear invalidation point: if price returns below the sweep low, the idea is wrong.
Combining Liquidity Sweeps With Volume Profile
Volume Profile helps you judge which sweeps matter most:
- A sweep below the Value Area Low followed by a close back inside value is a classic failed breakdown, often leading to a move towards the Point of Control.
- A sweep above the Value Area High that fails to hold signals rejection of higher prices.
- A sweep into a Low Volume Node can reverse sharply, because there is little trading history to hold price there.
You can also combine sweeps with a harmonic Potential Reversal Zone or with VWAP for extra confluence. On exchange-traded instruments, the Depth of Market can show large orders being absorbed at the swept level.
Common Mistakes
- Entering on the sweep itself. Wait for the close back inside the range and a structure shift.
- Calling every break a sweep. In strong trends, levels often break and hold.
- Ignoring news. High-impact releases can sweep both sides of a range in minutes.
- Stops too tight. Place the stop beyond the sweep extreme, not at the original level.
- Trading against the higher-timeframe trend without strong confirmation.
Frequently Asked Questions
What is a liquidity sweep in Forex?
It is a brief move beyond a high or low that triggers resting stop and breakout orders before price reverses back into the range.
What is the difference between buy-side and sell-side liquidity?
Buy-side liquidity rests above highs and becomes buy orders when triggered; sell-side liquidity rests below lows and becomes sell orders when triggered.
Is a liquidity sweep the same as a stop hunt?
They describe very similar events. “Stop hunt” suggests deliberate targeting, while “liquidity sweep” focuses on the orders being filled.
How do I avoid being caught in a liquidity sweep?
Avoid placing stops exactly at obvious levels, give them extra room beyond the level, and size positions so a wider stop still fits your risk.
Conclusion
Liquidity sweeps explain many of the sudden spikes and reversals that frustrate traders. By learning where liquidity rests, waiting for price to sweep it and close back inside, and confirming the reversal with displacement and a Market Structure Shift, you can turn these moves into structured trading opportunities. Combine them with Kill Zones and Volume Profile levels, and always define your risk before entering.
Risk warning: Trading Forex and CFDs on margin carries a high level of risk and may not be suitable for all investors. This article is for educational purposes only and is not investment advice.