
Every price chart you open on MetaTrader, TradingView or cTrader is built from the same four numbers: open, high, low and close. Together they are called OHLC, and they are the foundation of almost every technical tool a Forex trader uses, from simple candlesticks to advanced Volume Profile indicators. If you understand OHLC properly, you can read a chart the way professional traders do: not as a random series of shapes, but as a record of who controlled the market in each period.
In this guide you will learn what OHLC means, how it appears on bar and candlestick charts, and how to use OHLC data to read market sentiment and plan trades.
What Does OHLC Mean?
OHLC stands for Open, High, Low, Close. These are the four key prices recorded for every time period on a chart, whether that period is one minute, one hour or one day.
- Open: the first price traded when the period begins.
- High: the highest price reached during the period.
- Low: the lowest price reached during the period.
- Close: the last price traded when the period ends.
On a one-hour EUR/USD chart, for example, each bar or candle tells you where the pair started the hour, how far buyers pushed it up, how far sellers pushed it down, and where it finished when the hour closed.
Because the Forex market trades almost 24 hours a day, five days a week, the open and close of a daily candle depend on your broker’s server time. Many brokers use 5 p.m. New York time as the daily close, which is why daily candles can look slightly different between platforms.
OHLC Bars vs Candlesticks
The same OHLC data can be drawn in two popular ways.
OHLC bar charts
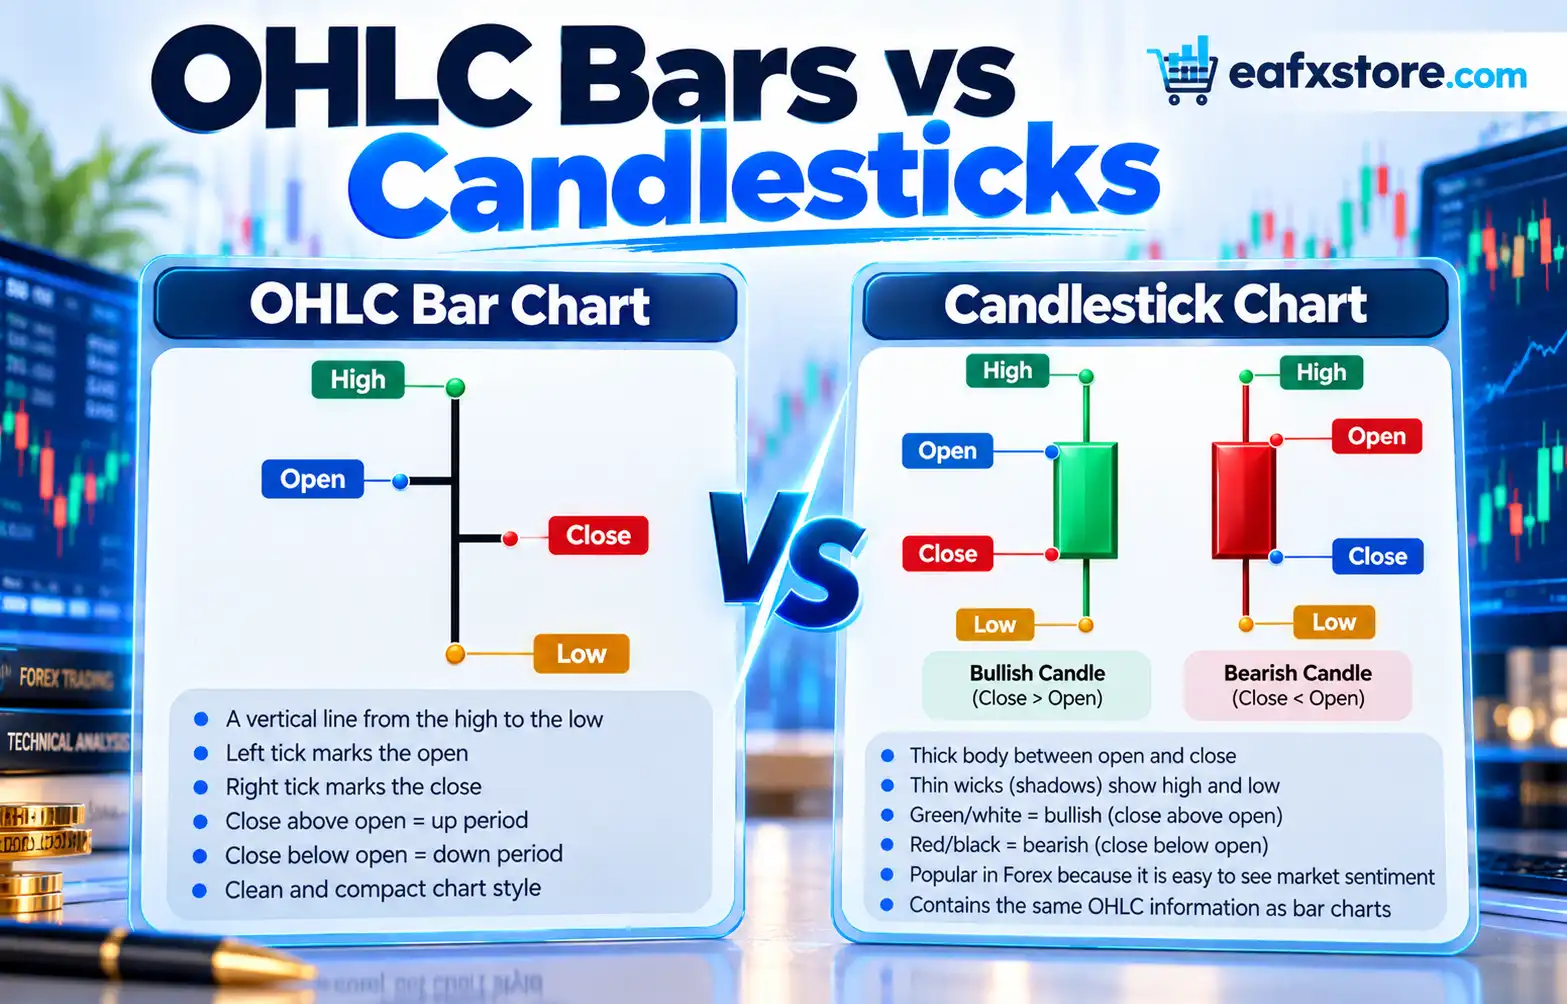
An OHLC bar is a vertical line from the high to the low. A small tick on the left marks the open, and a small tick on the right marks the close. If the close tick is above the open tick, the period was up; if it is below, the period was down. Bar charts are compact and popular with traders who want a clean chart with less visual noise.
Candlestick charts
A candlestick shows the same four prices with a thicker body between the open and close, and thin wicks (or shadows) reaching to the high and low. A bullish candle, where the close is above the open, is usually green or white. A bearish candle, where the close is below the open, is usually red or black.
Candlesticks are more popular in Forex because the body makes it easy to see at a glance who won the period. Both chart types contain exactly the same information; only the presentation differs.
How to Read Market Sentiment From OHLC
OHLC data is more than four numbers. The relationship between them tells a story.
Where the close sits in the range. A close near the high shows buyers were in control until the end of the period. A close near the low shows sellers dominated. A close in the middle suggests balance and indecision.
Wick length. A long upper wick means price moved higher but was rejected as sellers stepped in. A long lower wick means buyers defended lower prices. Long wicks at key levels are often the first sign that a move is losing strength.
Range size. The distance between high and low reflects volatility. Wide ranges often appear during news releases or session opens, while narrow ranges tend to form before breakouts.
Relationship to the previous candle. When a candle’s high and low sit completely inside the previous candle’s range, traders call it an inside bar, a sign of compression. When a candle breaks both the previous high and low, it signals expanding volatility.
These simple observations help you decide whether the market is bullish, bearish or neutral before you add any indicator.
OHLC and Volume Analysis
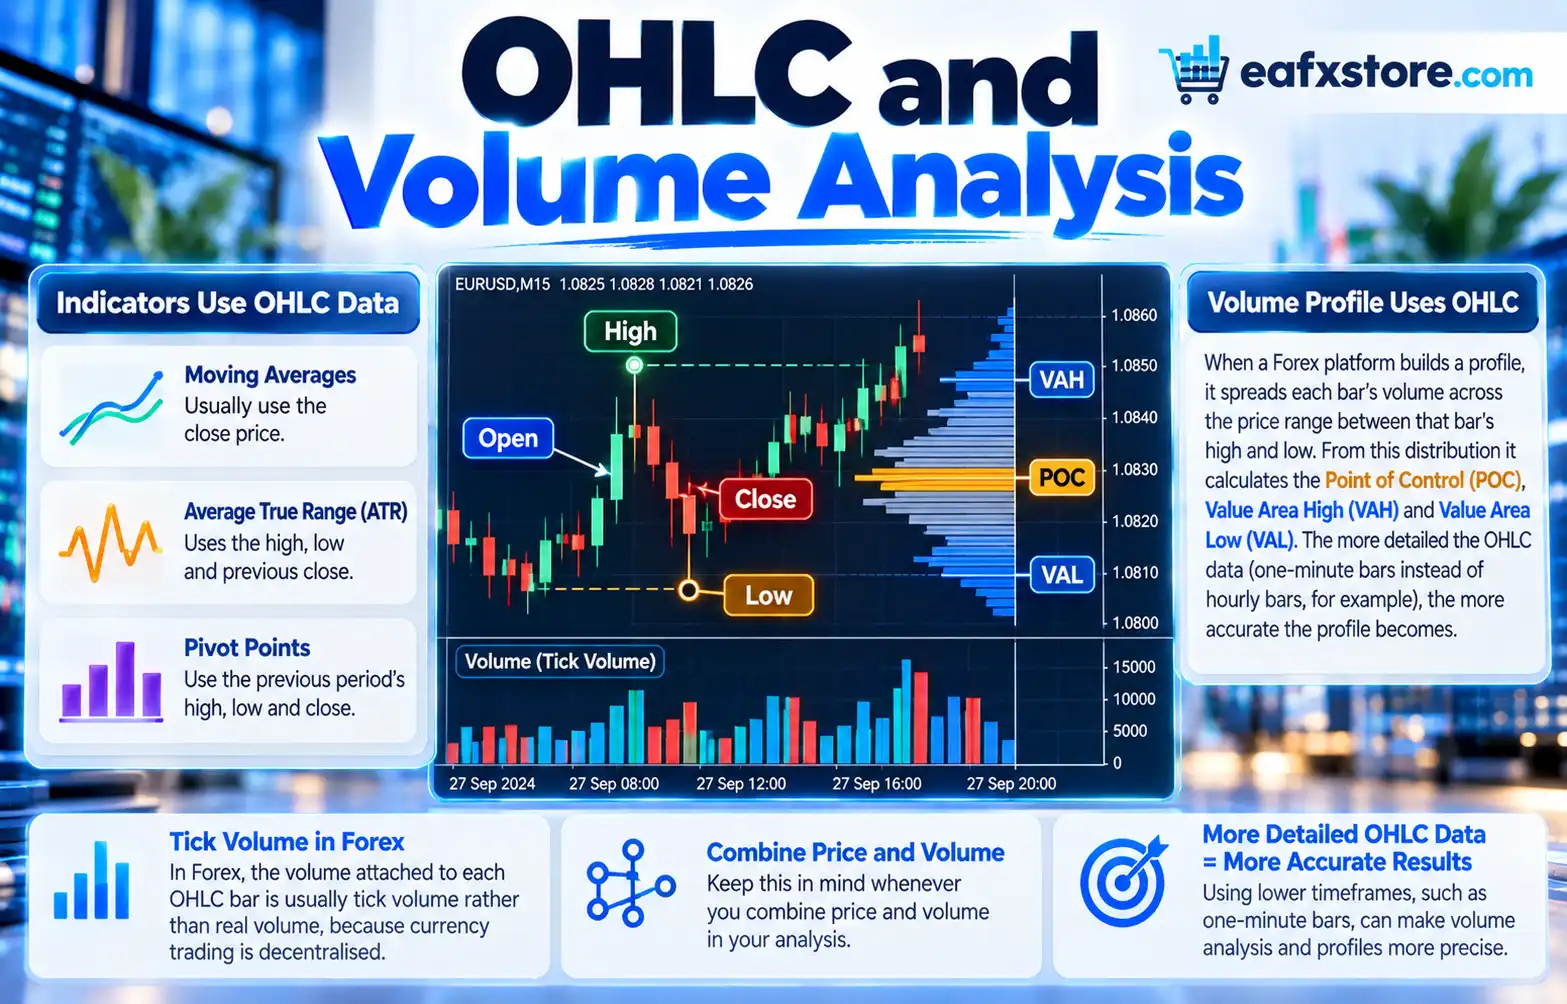
Most indicators are calculated from OHLC data. Moving averages usually use the close. The Average True Range (ATR) uses the high, low and previous close. Pivot points use the previous period’s high, low and close.
Volume Profile also relies on OHLC. When a Forex platform builds a profile, it spreads each bar’s volume across the price range between that bar’s high and low. From this distribution it calculates the Point of Control (POC), the Value Area High and the Value Area Low. The more detailed the OHLC data (one-minute bars instead of hourly bars, for example), the more accurate the profile becomes.
In Forex, the volume attached to each OHLC bar is usually tick volume rather than real volume, because currency trading is decentralised. Keep this in mind whenever you combine price and volume.
Practical Ways to Use OHLC in Your Trading
- Mark the previous day’s high and low. Many traders watch these levels, so they often act as support, resistance or breakout triggers.
- Wait for the close. A candle can look bullish mid-session and still close bearish. Waiting for the close confirms what actually happened.
- Use the right timeframe. Daily OHLC shows the bigger picture; hourly or 15-minute OHLC helps with entries.
- Combine OHLC with key levels. A strong rejection wick at the VAH, or a close above the POC, carries more weight than the same candle in the middle of nowhere.
- Check your broker’s server time. If daily candles look odd, confirm when your broker opens and closes the trading day.
Common Mistakes When Reading OHLC
- Judging a candle before it closes.
- Ignoring wicks and focusing only on the body.
- Comparing daily candles from brokers with different server times.
- Treating a single candle as a signal without the context of trend and key levels.
Frequently Asked Questions
What is OHLC in Forex?
OHLC stands for open, high, low and close, the four prices recorded for each period on a Forex chart.
Is an OHLC chart the same as a candlestick chart?
They use the same data. OHLC bars show the open and close as side ticks, while candlesticks show them as a filled body.
Which OHLC price is most important?
The close is usually considered the most important, because it shows where the market settled after the battle between buyers and sellers.
Why do daily candles differ between brokers?
Brokers use different server times, so their daily open and close fall at different hours.
Conclusion
OHLC is the language every chart is written in. Once you can read the open, high, low and close of each candle, and the story they tell together, tools such as Volume Profile become far easier to understand. Start by studying daily and hourly candles on your favourite currency pair, then learn how CFDs and different volume types shape the data behind your chart.
Risk warning: Trading Forex and CFDs on margin carries a high level of risk and may not be suitable for all investors. This article is for educational purposes only and is not investment advice.