
Trying to call the exact top or bottom of a move is one of the fastest ways to lose money in Forex. Professional reversal traders do something different: they identify a zone where several independent measurements agree that a reversal is likely, then wait for price to prove it. In harmonic trading, that zone is called the Potential Reversal Zone (PRZ).
This guide explains what a PRZ is, how it is built from harmonic patterns and Fibonacci ratios, how to confirm a reversal inside it, and how to combine it with Volume Profile and market structure.
What is a Potential Reversal Zone?
A Potential Reversal Zone (PRZ) is a price area where multiple Fibonacci ratios and pattern measurements converge, creating a high-probability location for price to reverse. The term was popularised by harmonic trading author Scott Carney, and it sits at the heart of patterns such as the Gartley, Bat, Butterfly and Crab.
The key word is potential. A PRZ does not tell you that price will reverse. It tells you where to pay close attention, because the odds of a reaction are higher there than elsewhere on the chart.
How a PRZ Is Built
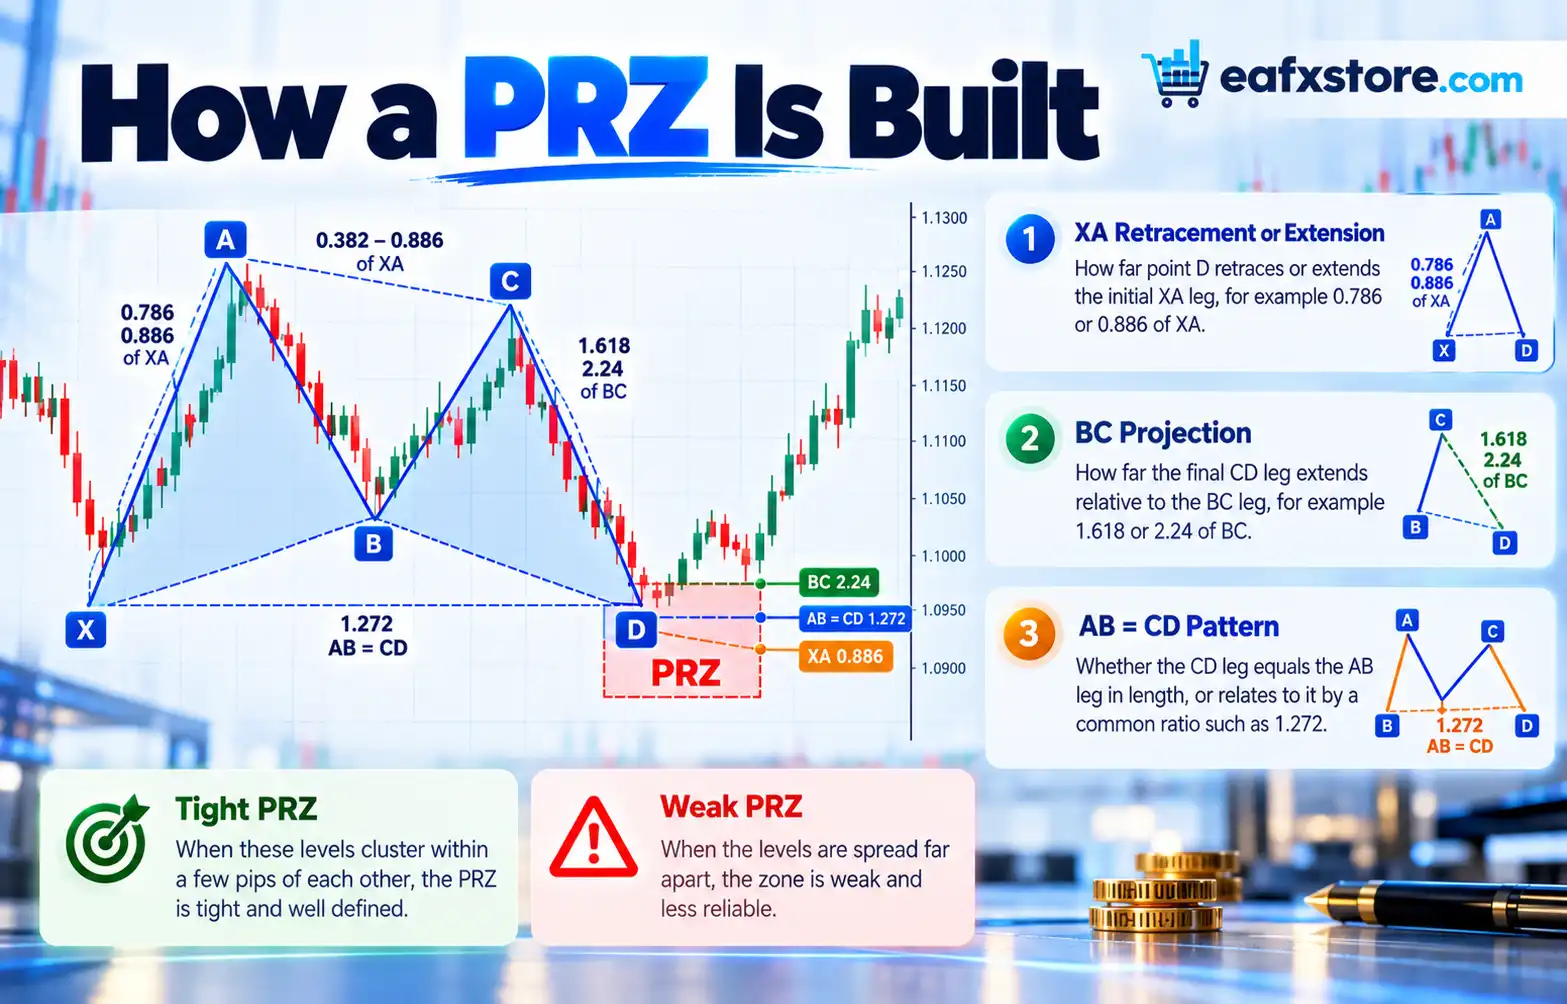
Harmonic patterns are five-point structures labelled X, A, B, C and D. The PRZ forms around point D, the completion of the pattern, and is defined by the overlap of several measurements:
- The XA retracement or extension. How far point D retraces or extends the initial XA leg, for example 0.786 or 0.886 of XA.
- The BC projection. How far the final CD leg extends relative to the BC leg, for example 1.618 or 2.24 of BC.
- The AB=CD pattern. Whether the CD leg equals the AB leg in length, or relates to it by a common ratio such as 1.272.
When these levels cluster within a few pips of each other, the PRZ is tight and well defined. When they are spread far apart, the zone is weak and less reliable.
Common Harmonic Patterns and Their PRZ
| Pattern | Point B (of XA) | Point D (of XA) | BC projection |
| Gartley | 0.618 | 0.786 | 1.272 – 1.618 |
| Bat | 0.382 – 0.50 | 0.886 | 1.618 – 2.618 |
| Butterfly | 0.786 | 1.27 | 1.618 – 2.24 |
| Crab | 0.382 – 0.618 | 1.618 | 2.24 – 3.618 |
These are the standard ratios used by most harmonic traders. Some platforms and authors allow small tolerances, so always check the settings of your harmonic pattern indicator.
A bullish pattern completes at a low, and its PRZ is a potential buying zone. A bearish pattern completes at a high, and its PRZ is a potential selling zone.
Why Price Reacts at the PRZ
Fibonacci ratios are watched by many traders, algorithms and institutions. When several of these levels overlap, a large number of participants may be looking to act in the same area: taking profit on the existing move, entering against it, or placing stops just beyond it. This concentration of interest can slow momentum and spark a reversal.
A PRZ becomes even more powerful when it lines up with other evidence, such as a previous swing high or low, a round number, or a key Volume Profile level.
How to Confirm a Reversal Inside the PRZ
Entering blindly the moment price touches the PRZ is risky. Price can slice straight through. Instead, look for confirmation:
- Candlestick rejection. Long wicks, pin bars or engulfing candles that show price is being rejected. Reading OHLC structure helps you judge the strength of each candle.
- A market structure shift. On a lower timeframe, wait for a Market Structure Shift (MSS) in the direction of the expected reversal.
- A liquidity sweep. Price often runs just beyond an obvious high or low inside the PRZ before turning, a behaviour described in ICT trading.
- Momentum divergence. RSI or MACD failing to confirm the new high or low as price enters the PRZ.
- Volume change. A spike in tick volume followed by a quick reversal can signal exhaustion.
Combining the PRZ With Volume Profile
Volume Profile adds a valuable second opinion to harmonic levels:
- A bearish PRZ that overlaps the Value Area High of a weekly profile combines a harmonic reversal level with the top of fair value.
- A bullish PRZ near the Value Area Low or a High Volume Node suggests buyers have defended that area before.
- If the PRZ sits inside a Low Volume Node, be careful: price can move quickly through thin zones, so demand stronger confirmation.
After a successful reversal, the Point of Control often makes a natural first target, because price tends to rotate back towards fair value.
A Step-by-Step PRZ Trade Plan
Here is a simple plan for a bullish PRZ. Reverse the steps for a bearish setup.
- Identify the pattern. Mark points X, A, B and C, and check that point B fits the ratio of a known pattern.
- Project the PRZ. Plot the XA retracement, the BC projection and the AB=CD completion. Mark the zone where they overlap.
- Check for confluence. Look for support, the VAL, an HVN or a round number inside or near the PRZ.
- Wait for price to enter the zone. Do not place a buy order far above the PRZ in anticipation.
- Wait for confirmation. A bullish engulfing candle, a lower-timeframe MSS or a sweep and reclaim of a recent low.
- Enter after the confirming candle closes.
- Place the stop below the PRZ, or below the next Fibonacci level beyond it, such as the X point for many patterns.
- Set targets. Harmonic traders often use the 0.382 and 0.618 retracements of the AD leg as the first and second targets. The POC can serve as an additional target.
Common Mistakes
- Forcing patterns. If the ratios do not fit, it is not a valid harmonic pattern.
- Treating the PRZ as a single price. It is a zone; price can overshoot before reversing.
- Skipping confirmation. A PRZ is a location, not an entry signal.
- Trading against a strong trend. Reversal patterns fail more often when the higher-timeframe trend is powerful and a news catalyst is driving the move.
- Using stops that are too tight. Place the stop beyond the zone, not in the middle of it.
Frequently Asked Questions
What does PRZ mean in trading?
PRZ stands for Potential Reversal Zone, an area where multiple Fibonacci and pattern measurements converge and price has a higher chance of reversing.
Which patterns use a PRZ?
Harmonic patterns such as the Gartley, Bat, Butterfly, Crab and AB=CD all complete in a PRZ.
Should I enter as soon as price reaches the PRZ?
It is safer to wait for confirmation, such as a rejection candle or a market structure shift on a lower timeframe.
How wide should a PRZ be?
The tighter the cluster of levels, the better. A wide PRZ offers weaker confluence and requires a larger stop.
Conclusion
The Potential Reversal Zone turns reversal trading from guesswork into a structured process. By combining Fibonacci measurements into one zone, adding confluence from Volume Profile and waiting for confirmation such as an MSS, you can trade reversals with defined risk and realistic targets. Remember that a PRZ is a place to watch, not a guarantee, and manage every trade accordingly.
Risk warning: Trading Forex and CFDs on margin carries a high level of risk and may not be suitable for all investors. This article is for educational purposes only and is not investment advice.