

🔢 Omega Pair Spread – Easy-to-Read Inputs Guide
🔢 Before You Start
⚙️ Install and Open the Indicator
🔹 Step 1 — Copy the indicator file into MQL5Indicators using File → Open Data Folder.
🔹 Step 2 — Refresh the Navigator or restart MetaTrader 5.
🔹 Step 3 — Open the symbol and timeframe to analyse, for example XAUUSD H1.
🔹 Step 4 — Drag Omega Pair Spread from Navigator onto the chart.
🔹 Step 5 — On the Dependencies tab, enable Allow DLL imports.
🔹 Step 6 — On the Inputs tab, configure the settings and click OK.
🔹 Edit Settings Later — Press Ctrl+I, select Omega Pair Spread and click Edit.
⚙️ Important DLL Requirement
🔹 Allow DLL imports — Required for the licence check, Telegram alerts and WEB / TELEGRAM buttons.
🔹 Global DLL Setting — Also enable Tools → Options → Expert Advisors → Allow DLL imports.
🔢 Licence
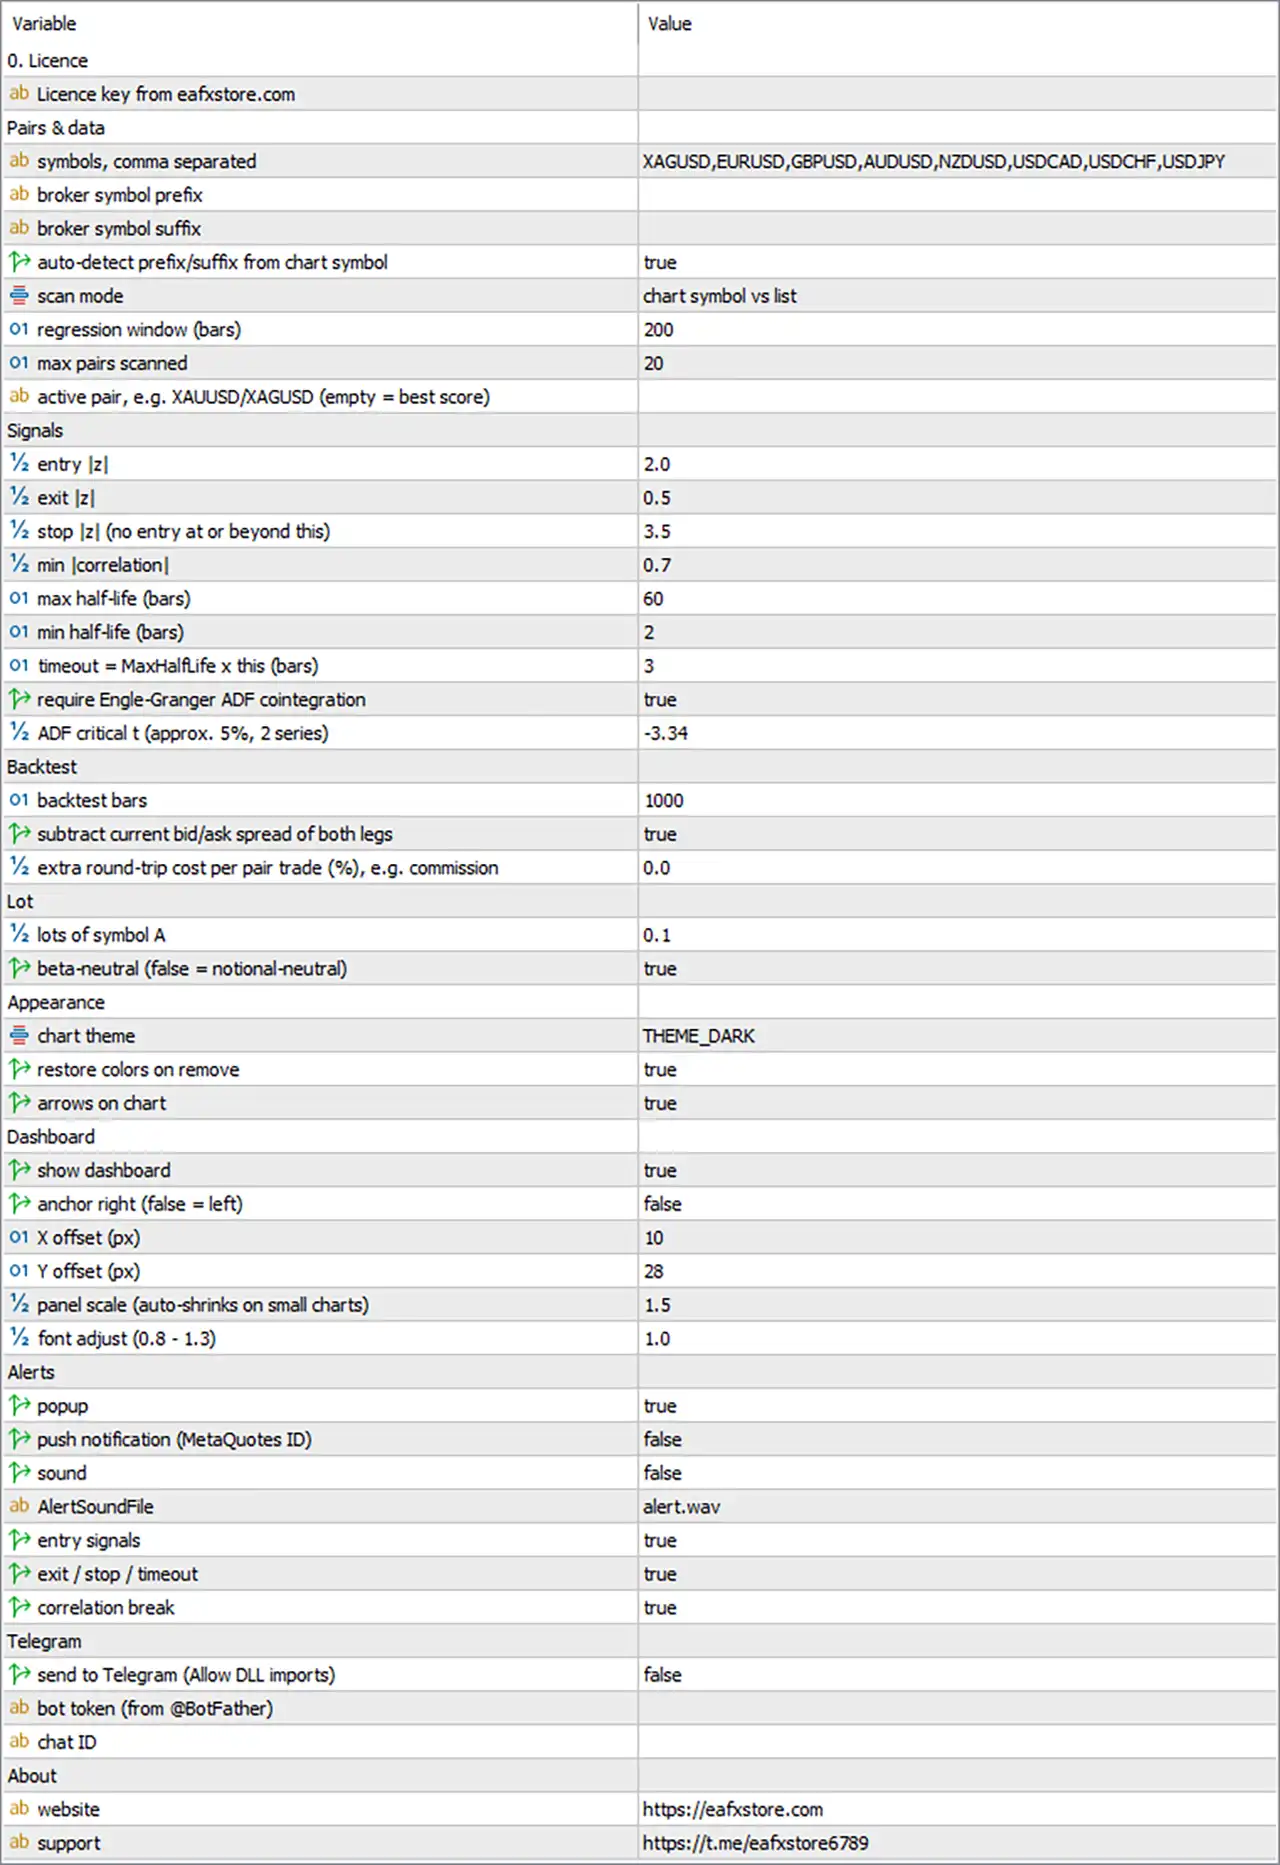
🔹 Licence key [InpLicenseKey] — Default: (empty) — Personal licence key received from eafxstore.com. Recommended: enter the valid licence key provided.
🔹 Licence Verification — At startup, the key is checked together with the trading account number, broker and server name.
🔹 Automatic Formatting — Spaces around the key are removed and letters are converted to uppercase automatically.
🔹 Re-check Interval — The licence is checked every 30 minutes and immediately after switching to another trading account.
🔹 Offline Grace Period — If the licence server cannot be reached, the indicator can continue working for up to 72 hours after the last successful check.
🔹 Computer Clock — Keep the system clock correct. Moving the clock backwards by more than 5 minutes can invalidate the offline grace period.
🔢 Pairs & Data
These settings control which symbols are analysed, how pairs are created and how much historical data is used.
⚙️ Symbol Selection
🔹 PairList — Symbol list [PairList] — Default: XAGUSD,EURUSD,GBPUSD,AUDUSD,NZDUSD,USDCAD,USDCHF,USDJPY — List of instruments used for pair analysis. Limit: up to 16 symbols in total.
🔹 Symbol Names — Enter base symbol names without broker prefixes or suffixes. The indicator can add them automatically.
🔹 Recommended Pair Relationships — Use instruments with an economic relationship and positive correlation, such as XAUUSD/XAGUSD, AUDUSD/NZDUSD or EURUSD/GBPUSD.
🔹 Avoid Opposite-Correlation Pairs — Version 1.10 always suggests opposite trades for the two legs, so negatively correlated pairs such as EURUSD/USDCHF are not suitable.
🔹 Chart Symbol — The chart symbol is ignored inside PairList, so it can remain in the list.
⚙️ Broker Symbol Names
🔹 SymPrefix — Broker symbol prefix [SymPrefix] — Default: (empty) — Text placed before the symbol name by the broker. Example: pro. for pro.EURUSD.
🔹 SymSuffix — Broker symbol suffix [SymSuffix] — Default: (empty) — Text placed after the symbol name. Examples: m, .r, -ECN, _i.
🔹 AutoAffix — Auto-detect prefix and suffix [AutoAffix] — Default: true — Automatically detects broker prefixes and suffixes from the chart symbol. Recommended: true.
🔹 Example — On XAUUSDm, the indicator can detect suffix m and search for EURUSDm, GBPUSDm, etc.
🔹 Manual Prefix / Suffix — If symbols are still not found, check the exact names in Market Watch (Ctrl+U) and enter SymPrefix / SymSuffix manually.
⚙️ Pair Scanning
🔹 ScanMode — Scan mode [ScanMode] — Default: SCAN_BASE — Controls how pairs are created.
🔹 SCAN_BASE — Pairs the chart symbol with every symbol in PairList. Example: on XAUUSD, the default list creates XAUUSD/XAGUSD, XAUUSD/EURUSD, etc.
🔹 SCAN_ALL — Creates every possible combination between symbols in PairList. For example, 8 symbols create 28 combinations.
🔹 SCAN_BASE Use Case — Suitable when analysing or trading one specific instrument.
🔹 SCAN_ALL Use Case — Suitable for discovering which combinations have stronger statistical relationships.
🔹 Pair Direction — The first symbol is Leg A and the second is Leg B. Signals are displayed as BUY A / SELL B or SELL A / BUY B.
⚙️ Statistical Window
🔹 Window — Regression window [Window] — Default: 200 bars — Number of closed bars used to calculate correlation, beta, spread mean, standard deviation, half-life, ADF and Hurst. Recommended: 150–500.
🔹 Larger Window — Produces more stable statistics but reacts more slowly when the relationship changes.
🔹 Smaller Window — Adapts faster but can produce noisier statistics and more false signals.
🔹 Window vs MaxHalfLife — Keep Window comfortably larger than MaxHalfLife, ideally at least 3× larger.
⚙️ Pair Limit
🔹 MaxPairs — Maximum pairs scanned [MaxPairs] — Default: 20 — Maximum number of pairs created from the symbol list. Range: 1–40; values above 40 are capped at 40.
🔹 Pair Order — Pairs are created in the order of the symbols in PairList. Later combinations are dropped when the maximum is reached.
🔹 Performance — Every pair is recalculated on each new bar. Keep the number moderate on slower computers or when many charts are open.
⚙️ Active Pair
🔹 ActivePair — Active pair [ActivePair] — Default: (empty) — Selects the pair shown in detail on the dashboard.
🔹 Empty ActivePair — The dashboard automatically follows the pair with the highest score.
🔹 Manual ActivePair — Enter two base names separated by /, for example XAUUSD/XAGUSD.
🔹 Pair Order — Spaces are ignored, the order does not matter and broker suffixes are not required.
🔹 Invalid Pair — If the selected pair was not created by the scan or has insufficient data, the indicator falls back to the best-scoring pair.
🔢 Signals
These settings determine when a pair becomes tradable and when a pair trade should enter or exit. Z-values refer to the spread z-score, which measures how many standard deviations the spread is away from its average.
Entry and Exit
🔹 Zin — Entry z-score [Zin] — Default: 2.0 — Entry is suggested when the z-score reaches +Zin or −Zin. Recommended: 1.8–2.5.
🔹 Positive Zin — At +Zin, the signal is SELL A / BUY B.
🔹 Negative Zin — At −Zin, the signal is BUY A / SELL B.
🔹 Higher Zin — Produces fewer but more extreme entry conditions.
🔹 Lower Zin — Produces more entries with a smaller expected mean-reversion move.
🔹 Important — Zin must be smaller than Zstop, otherwise a valid entry cannot occur.
🔹 Zout — Exit z-score [Zout] — Default: 0.5 — Closes the position when the absolute z-score returns to Zout or below. Recommended: 0.0–0.7.
🔹 Zout = 0 — Waits for the spread to return fully to its mean, which can produce larger moves but longer holding times.
🔹 Zout = 0.5–0.7 — Takes profit earlier and can produce more completed exits.
🔹 Important — Zout must be smaller than Zin.
🔹 Zstop — Stop z-score [Zstop] — Default: 3.5 — Closes the trade when the spread continues moving away from its mean and reaches the stop threshold. Recommended: 3.0–4.5.
🔹 New Entries at Zstop — New entries are blocked while the absolute z-score is at or beyond Zstop.
🔹 Zin / Zstop Gap — Keep at least 1.0 between entry and stop thresholds so normal fluctuations do not trigger the stop immediately after entry.
🔢 Pair Quality Filters
🔹 MinCorr — Minimum correlation [MinCorr] — Default: 0.70 — Minimum absolute correlation required for a pair to be tradable. Recommended: 0.65–0.85.
🔹 Correlation Break — An open position is closed if correlation falls below MinCorr − 0.15.
🔹 High MinCorr — Values above 0.90 allow very few pairs to pass.
🔹 Low MinCorr — Values below 0.60 allow weaker relationships to pass.
🔹 MaxHalfLife — Maximum half-life [MaxHalfLife] — Default: 60 bars — Maximum time required for the spread to close half of its distance toward the mean. Recommended: 30–80.
🔹 Half-Life Filter — Pairs with a half-life above MaxHalfLife are considered too slow and become not tradable.
🔹 Timeframe Effect — 60 bars equals about 2.5 days on H1 but about 10 days on H4.
🔹 MinHalfLife — Minimum half-life [MinHalfLife] — Default: 2 bars — Prevents extremely short-lived relationships from being considered tradable. Recommended: 2–5.
🔹 Reason for MinHalfLife — Extremely short half-life can indicate mostly noise, where trading costs may consume the expected move.
Holding Time
🔹 MaxHoldMult — Maximum holding multiplier [MaxHoldMult] — Default: 3 — Determines the maximum holding time from MaxHalfLife × MaxHoldMult. Recommended: 2–4.
🔹 Default Timeout — 60 × 3 = 180 bars.
🔹 Timeout Rule — A position is closed after the calculated timeout even if neither Zout nor Zstop has been reached.
🔹 Lower MaxHoldMult — Frees capital from trades that stop behaving as expected.
🔹 Higher MaxHoldMult — Gives slower pairs more time to mean-revert.
🔢 Cointegration / ADF
🔹 UseADF — Require cointegration test [UseADF] — Default: true — Requires the spread to pass the Dickey-Fuller / Engle-Granger cointegration test before the pair becomes tradable. Recommended: true.
🔹 ADF Requirement — The ADF t-statistic must be at or below AdfCrit.
🔹 Purpose — Helps reject pairs that are correlated only because they trend together without providing stronger evidence of mean reversion.
🔹 UseADF = false — Can be used for experiments or when too few pairs pass the test, but allows weaker evidence.
🔹 AdfCrit — ADF critical value [AdfCrit] — Default: −3.34 — Threshold used by the cointegration test.
🔹 Approximate Critical Values — −3.90 ≈ 1%, −3.34 ≈ 5%, −3.04 ≈ 10%.
🔹 More Negative AdfCrit — Creates a stricter test and allows fewer pairs to pass.
🔹 Less Negative AdfCrit — Allows more pairs to pass but with weaker statistical evidence.
🔢 Backtest
🔹 BacktestBars — Backtest length [BacktestBars] — Default: 1000 bars — Number of historical bars used to replay the signal rules for the active pair. Recommended: 1000–3000.
🔹 Required History — The chart needs at least BacktestBars + Window bars of history. If insufficient, the backtest is automatically shortened.
🔹 Minimum Backtest History — At least 50 bars are required for the backtest to run.
🔹 Longer Backtest — Includes more trades and market conditions but requires more calculation time because regression is re-estimated on every bar.
🔹 BtSpreadCost — Deduct spread cost [BtSpreadCost] — Default: true — Includes the current bid/ask spread cost of both legs in backtest calculations. Recommended: true.
🔹 Spread Cost Formula — Leg A spread + |beta| × Leg B spread, expressed as a percentage of price.
🔹 Spread Timing — The spread is read when the backtest runs. Unusually wide spreads can therefore increase the estimated cost.
🔹 BtExtraCostPct — Extra cost per trade [BtExtraCostPct] — Default: 0.0% — Adds an extra round-trip cost to each pair trade.
🔹 Example — 0.01 represents 0.01% extra cost per round-trip pair trade.
🔹 Use Case — Can represent commissions or an allowance for slippage.
🔢 Lot Settings
🔹 BaseLots — Lots of symbol A [BaseLots] — Default: 0.10 — Trade size used for Leg A. Recommended: set according to the risk plan.
🔹 Leg B Size — Calculated automatically from BaseLots and the selected beta-neutral setting.
🔹 Risk Control — Size BaseLots so that a move toward Zstop does not exceed the planned risk per trade.
🔹 Important — The indicator does not place trades. BaseLots is used only for the suggested lot ratio.
🔹 BetaNeutral — Beta-neutral sizing [BetaNeutral] — Default: true — Calculates Leg B size using the measured beta and value of one lot for each symbol. Recommended: true.
🔹 Beta-Neutral Formula — Lots B = BaseLots × |beta| × (value of 1 lot A ÷ value of 1 lot B).
🔹 BetaNeutral = false — Replaces beta with 1, producing equal money value in both legs instead of beta-neutral sizing.
🔹 Lot Rounding — Leg B volume is rounded to the broker's volume step, with at least one volume step.
🔢 Appearance
🔹 Theme — Chart theme [Theme] — Default: THEME_DARK — Controls the chart theme.
🔹 THEME_NONE — Keeps the existing chart appearance.
🔹 THEME_DARK — Applies the dark dashboard-style theme.
🔹 THEME_MIDNIGHT — Applies the midnight theme.
🔹 THEME_LIGHT — Applies the light theme.
🔹 Theme Effect — The theme changes chart background, grid, candles and price lines and switches the chart to candlesticks.
🔹 RestoreTheme — Restore colours on removal [RestoreTheme] — Default: true — Restores the previous chart colours, grid and chart type when the indicator is removed.
🔹 ShowArrows — Show arrows on chart [ShowArrows] — Default: true — Displays entry arrows on the latest closed bar when an entry signal involves the chart symbol.
🔹 Arrow Direction — Green up arrow = BUY direction for the chart symbol; red down arrow = SELL direction.
🔹 Example — For XAUUSD/XAGUSD, a SELL A / BUY B signal displays a red arrow on XAUUSD and a green arrow on XAGUSD.
🔢 Dashboard
🔹 ShowDash — Show dashboard [ShowDash] — Default: true — Shows or hides the information dashboard. Arrows and alerts continue working when hidden.
🔹 DashRight — Anchor to the right [DashRight] — Default: false — Places the dashboard on the left when false and right when true.
🔹 DashX — Horizontal offset [DashX] — Default: 10 pixels — Distance from the selected chart edge.
🔹 DashY — Vertical offset [DashY] — Default: 28 pixels — Distance from the top of the chart.
🔹 DashScale — Panel scale [DashScale] — Default: 1.5 — Controls the overall dashboard size. Recommended: 1.0–1.8.
🔹 High-Resolution Screens — 1.5–1.8 can be suitable for high-resolution displays.
🔹 Laptop Screens — 1.0–1.3 can provide a more compact dashboard.
🔹 DashFontAdj — Font size adjustment [DashFontAdj] — Default: 1.0 — Adjusts dashboard text size without changing the layout. Recommended: 0.8–1.3.
🔹 Lower than 1.0 — Makes dashboard text smaller.
🔹 Higher than 1.0 — Makes dashboard text larger.
🔹 Dashboard Auto-fit — The panel is automatically reduced so it does not exceed 45% of chart width or chart height. Minimum scale is 0.55.
Move the Dashboard
🔹 Drag Dashboard — Drag the panel header with the mouse to reposition it.
🔹 Saved Position — A manually moved dashboard position overrides DashRight, DashX and DashY.
🔹 Reset Position — Press F3 and delete global variables beginning with OMSTAT_DASH, then reattach the indicator.
🔢 Alerts
Alerts are generated only for new events while the indicator is running. Historical events are not alerted when the indicator first loads.
🔹 AlertPopup — Popup alert [AlertPopup] — Default: true — Displays the standard MetaTrader alert window with sound.
🔹 AlertPush — Push notification [AlertPush] — Default: false — Sends alerts to the MetaTrader mobile application.
🔹 Push Setup — Enter the MetaQuotes ID under Tools → Options → Notifications and enable push notifications.
🔹 AlertSoundOn — Play sound [AlertSoundOn] — Default: false — Plays the sound file specified by AlertSoundFile.
🔹 AlertSoundFile — Sound file [AlertSoundFile] — Default: alert.wav — Name of the .wav file located in the terminal's Sounds folder.
🔹 AlertEntry — Alert on entry signals [AlertEntry] — Default: true — Alerts when a new pair-trading entry is suggested. The message includes both leg directions, z-score, correlation, half-life, ADF and Leg B lots.
🔹 AlertExit — Alert on exit, stop and timeout [AlertExit] — Default: true — Alerts when a trade should close because the spread returned to the mean, reached the stop or exceeded the maximum holding time.
🔹 AlertBreak — Alert on correlation break [AlertBreak] — Default: true — Alerts when correlation falls below MinCorr − 0.15.
🔢 Telegram
🔹 TgEnable — Send alerts to Telegram [TgEnable] — Default: false — Sends indicator alerts through a Telegram bot. Recommended: true after Telegram is configured.
🔹 Message Queue — Telegram messages are queued and sent one per second to avoid blocking the chart.
🔹 TgToken — Bot token [TgToken] — Default: (empty) — Telegram bot API token received from @BotFather. Keep it private.
🔹 TgChatID — Chat ID [TgChatID] — Default: (empty) — Identifies the personal chat, group or channel receiving the alerts.
Telegram Setup
🔹 Step 1 — Open @BotFather in Telegram and send /newbot.
🔹 Step 2 — Copy the generated bot token into TgToken.
🔹 Step 3 — Open a chat with the new bot and press Start, or add it to the required group/channel.
🔹 Step 4 — Obtain the required Chat ID and enter it into TgChatID.
🔹 Step 5 — Set TgEnable = true.
🔹 Step 6 — Make sure Allow DLL imports is enabled.
🔹 Step 7 — Click TEST TG on the dashboard.
🔹 Telegram Errors — Check the Experts tab if the test message fails.
🔢 About
🔹 AboutWeb — Website link [AboutWeb] — Default: https://eafxstore.com — Website opened by the WEB button.
🔹 AboutTelegram — Support link [AboutTelegram] — Default: https://t.me/eafxstore6789 — Support page opened by the TELEGRAM button.
🔢 Example Configurations
⚙️ Trade Gold vs Silver
🔹 Chart — XAUUSD H1
🔹 ScanMode — SCAN_BASE
🔹 PairList — XAGUSD
🔹 ActivePair — XAUUSD/XAGUSD
⚙️ Discover FX Pairs
🔹 Chart — Any H1 chart
🔹 ScanMode — SCAN_ALL
🔹 PairList — EURUSD,GBPUSD,AUDUSD,NZDUSD
🔹 MaxPairs — 20
🔹 ActivePair — Empty
⚙️ Fewer, Higher-Quality Signals
🔹 Zin — 2.5
🔹 Zstop — 4.0
🔹 MinCorr — 0.80
🔹 AdfCrit — −3.90
🔹 Window — 300
This configuration uses stricter statistical and entry conditions, resulting in fewer qualifying signals.
⚙️ More Frequent Signals
🔹 Zin — 1.8
🔹 Zout — 0.5
🔹 MinCorr — 0.65
🔹 AdfCrit — −3.04
🔹 Window — 150
This configuration uses more permissive conditions and can produce more qualifying signals.
⚙️ Phone Alerts Only
🔹 AlertPopup — false
🔹 AlertPush — true
🔹 Alternative — Enable TgEnable = true with a valid Telegram token and Chat ID.
🔢 Simple Omega Pair Spread Logic
🔹 Step 1 — Select Symbols — PairList defines the instruments available for analysis.
🔹 Step 2 — Build Pairs — SCAN_BASE compares the chart symbol against the list, while SCAN_ALL evaluates every possible combination.
🔹 Step 3 — Calculate Relationship — The indicator measures correlation, beta and the statistical behaviour of the spread.
🔹 Step 4 — Check Mean Reversion — Half-life, correlation and optionally the ADF cointegration test determine whether a pair is tradable.
🔹 Step 5 — Calculate Z-Score — The spread is converted into a z-score showing how far it has moved from its average.
🔹 Step 6 — Entry — A signal appears when the z-score reaches +Zin or −Zin and the pair passes the tradability filters.
🔹 Step 7 — Pair Direction — The signal uses opposite positions on the two legs, such as BUY A / SELL B.
🔹 Step 8 — Mean-Reversion Exit — The position is closed when the absolute z-score falls to Zout or below.
🔹 Step 9 — Statistical Stop — The position is closed when the absolute z-score reaches Zstop.
🔹 Step 10 — Correlation Break — The position can also close if correlation falls below MinCorr − 0.15.
🔹 Step 11 — Maximum Holding Time — The position closes after MaxHalfLife × MaxHoldMult bars if no other exit occurs.
🔹 Step 12 — Suggested Position Size — BaseLots defines Leg A size, while BetaNeutral determines how Leg B is sized from the measured hedge ratio.
🔢 Recommended Starting Settings
⚙️ Balanced Pair Trading
🔹 Window — 200
🔹 MaxPairs — 20
🔹 Zin — 2.0
🔹 Zout — 0.5
🔹 Zstop — 3.5
🔹 MinCorr — 0.70
🔹 MaxHalfLife — 60
🔹 MinHalfLife — 2
🔹 MaxHoldMult — 3
🔹 UseADF — true
🔹 AdfCrit — −3.34
🔹 BacktestBars — 1000
🔹 BtSpreadCost — true
🔹 BetaNeutral — true
These settings follow the default configuration from the source guide and provide a balanced starting point for testing.
⚙️ Stricter Statistical Filtering
🔹 Window — 300
🔹 Zin — 2.5
🔹 Zstop — 4.0
🔹 MinCorr — 0.80
🔹 AdfCrit — −3.90
This configuration requires stronger correlation, a more extreme spread deviation and stricter ADF evidence.
⚙️ More Frequent Signals
🔹 Window — 150
🔹 Zin — 1.8
🔹 Zout — 0.5
🔹 MinCorr — 0.65
🔹 AdfCrit — −3.04
This configuration relaxes several filters and can increase the number of qualifying signals.
🔢 Troubleshooting
🔹 “Please enter your licence key” — InpLicenseKey is empty. Enter the licence key received from eafxstore.com.
🔹 “Please tick Allow DLL imports” — DLL imports are disabled. Enable them on the Dependencies tab and under Tools → Options → Expert Advisors.
🔹 “Cannot reach the licence server” — Check the internet connection and firewall. The indicator can normally continue for up to 72 hours after a successful check.
🔹 “symbol not found” — The broker uses different symbol names. Check Market Watch and configure SymPrefix / SymSuffix.
🔹 Dashboard shows “NO DATA” — There is insufficient aligned history. Load more history on all required symbols or reduce Window.
🔹 Pairs show “NOT TRADABLE” — Correlation, half-life or ADF conditions are not satisfied. Try different pairs or adjust MinCorr / AdfCrit.
🔹 Backtest shows “-” — There is insufficient history. Load more data or reduce BacktestBars / Window.
🔹 Telegram test fails — Check the bot token, Chat ID, DLL permission and that the bot was started. Check the Experts tab for details.
🔹 Panel too large or too small — Adjust DashScale and DashFontAdj.
🔢 Important Risk Note
🔹 Omega Pair Spread is an analysis and signal indicator — It does not place orders automatically.
🔹 Backtest Results — Historical backtests are not guarantees of future performance.
🔹 Pair Relationship Risk — Correlation and mean-reversion relationships can change over time.
🔹 Trading Risk — Leveraged products carry a high level of risk. Test configurations on a demo account before live trading.