
Omega Liquidity Map Indicator MT5
Omega Liquidity Map IndicatorOmega Liquidity Map Indicator ReviewsOmega Liquidity Map Indicator ReviewOmega Liquidity Map Indicator MT5 ReviewsOmega Liquidity Map Indicator MT5 Review
Updated 29 Sept 2026

Omega Liquidity Map Indicator MT5

Omega Liquidity Map is useful for traders of forex, gold, indices, CFDs, and cryptocurrencies, helping them identify liquidity zones, breakout behavior, order flow, and market conditions based on trading volume.

Buy now — $25Add to cart
Download link right after paymentLifetime licenceInstall guide includedFree updates to new versions
Pay with Visa · MastercardUSDT · BTC · ETHBinance Pay
Not sure it fits your broker or account?Ask a question
Optimize Settings

Recommended settings for Omega Liquidity Map Indicator MT5

🔢 Omega Liquidity Map – Simple Inputs Guide

This guide explains the Omega Liquidity Map settings in a simple and easy-to-understand way.

Each setting includes its default value, what it does, and a recommended value when applicable.
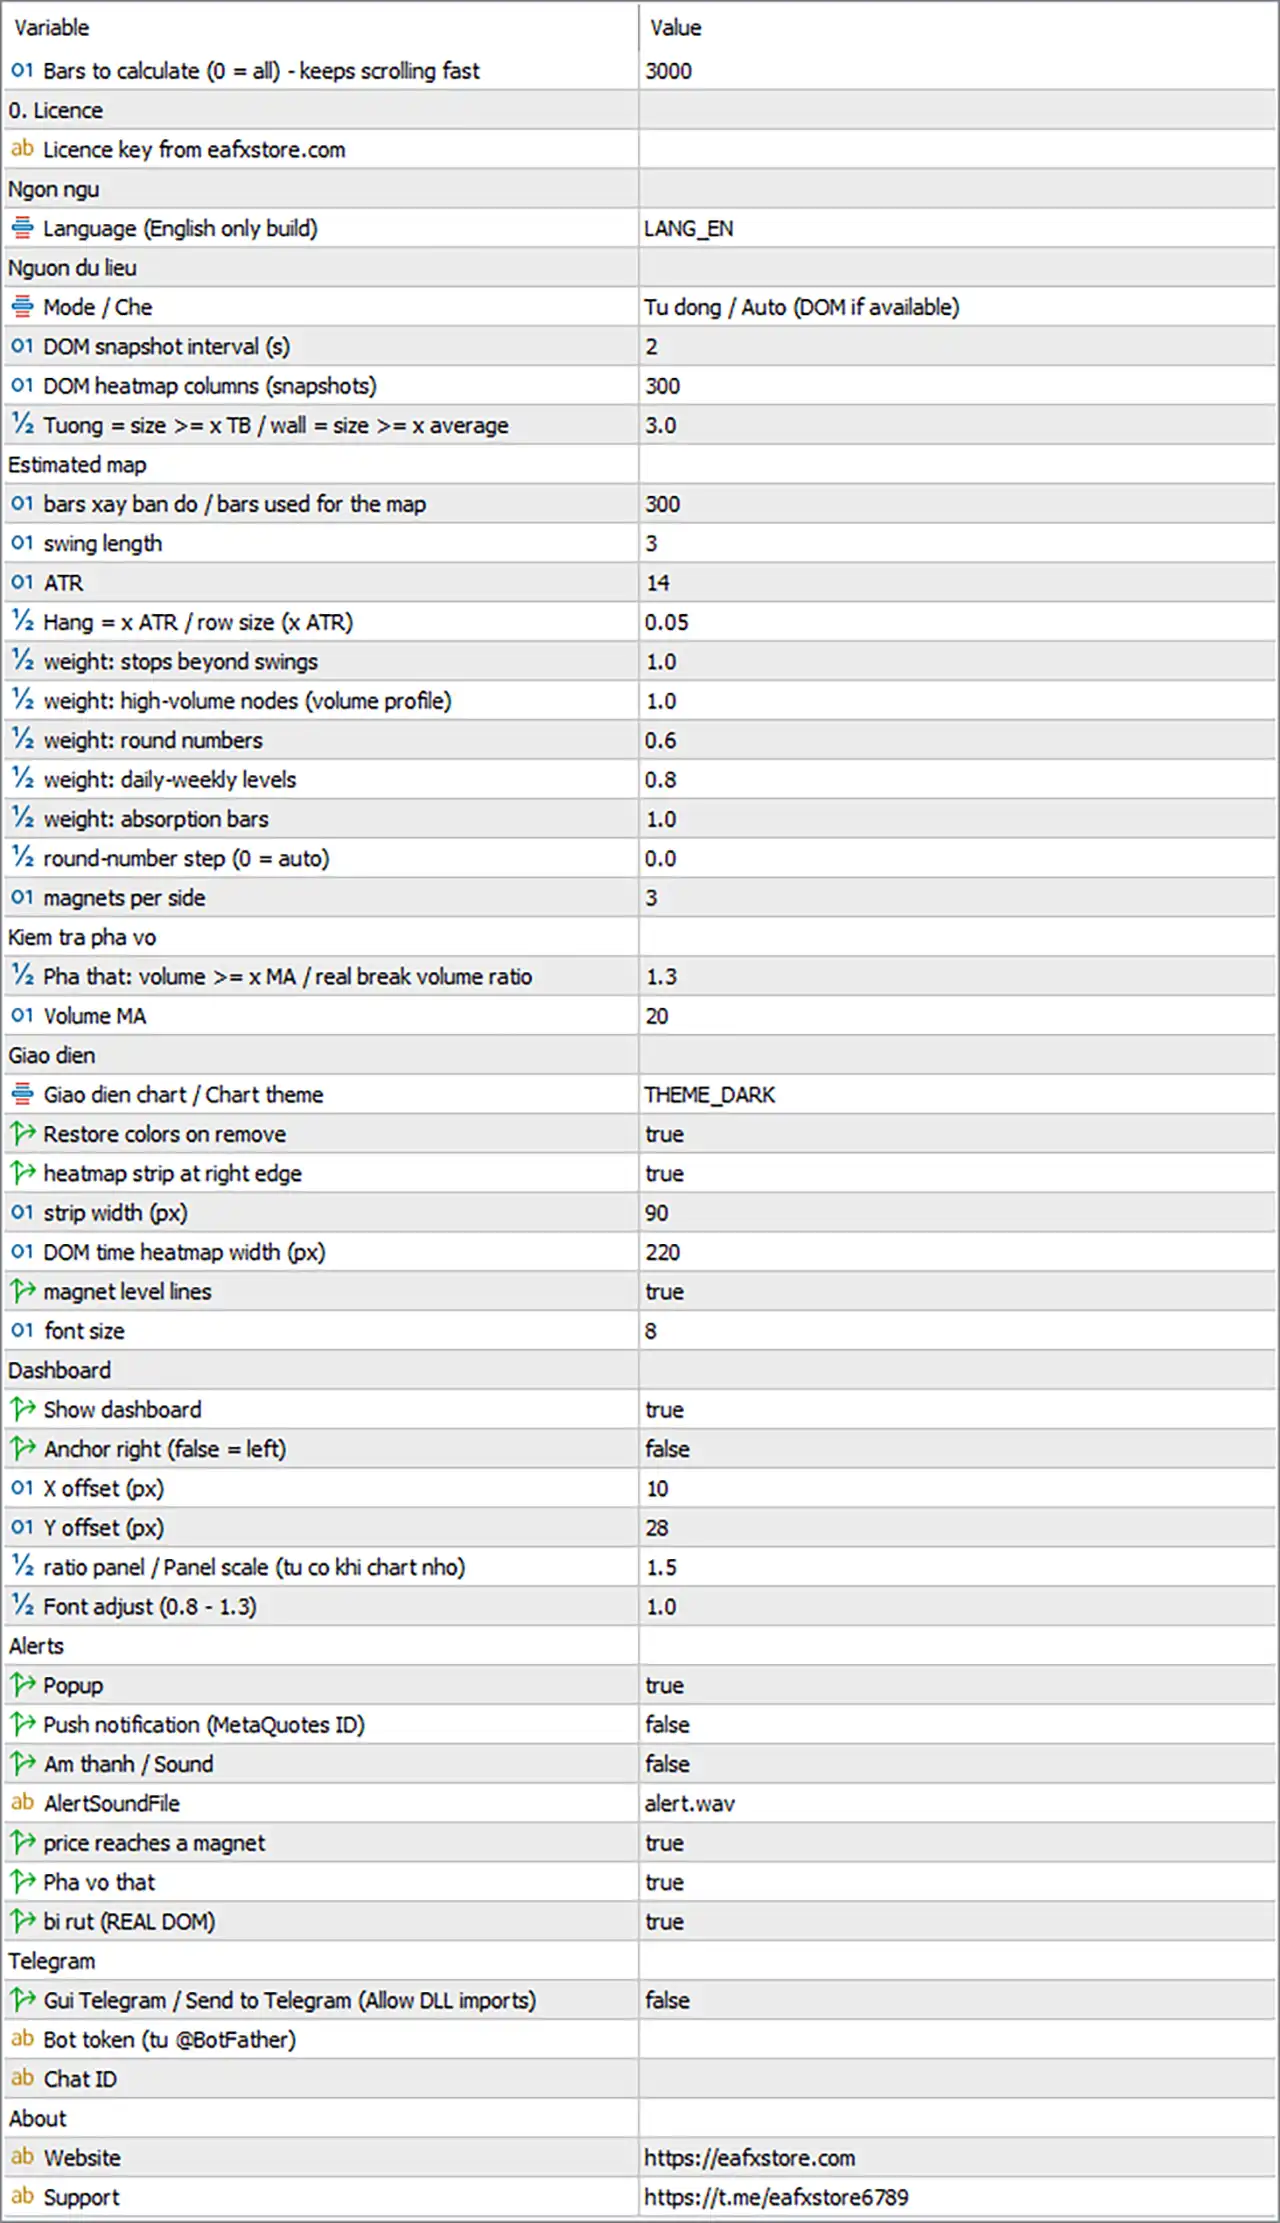
Omega Liquidity Map Indicator MT5 Settings Panel

🔢 Installation

🔹 Open MetaTrader 5.

🔹 Go to File → Open Data Folder.

🔹 Open the MQL5 → Indicators folder.

🔹 Copy OmegaLiquidityMap_v1.0.ex5 into the Indicators folder.

🔹 Restart MetaTrader 5 or refresh the Navigator.

🔹 Attach the indicator to a chart.

🔹 Enable Allow DLL imports if required.

🔹 Enter the licence key in InpLicenseKey.

🔢 General Settings

🔹 Bars to Calculate [MaxBarsCalc] — Default: 3000 — Controls how many recent bars are processed. Recommended: 2000–3000.

A lower value can reduce computer workload, especially when many charts are open.

🔢 Licence

🔹 Licence Key [InpLicenseKey] — Default: "" — Enter the licence key to activate the indicator.

The licence is linked to the trading account and is checked online periodically.

If the licence server is temporarily unavailable, the indicator has a default 72-hour grace period.

🔢 Data Source

Omega Liquidity Map can use REAL DOM data or create an Estimated Liquidity Map.

🔹 Mode / Check [LqMode] — Default: Auto — Selects the liquidity data source. Recommended: Auto.

Auto uses REAL DOM when the broker provides usable data. Otherwise, it automatically uses the Estimated Liquidity Map.

Estimated only uses only the calculated liquidity map.

Real DOM only is intended for brokers that provide usable DOM data.

🔹 DOM Snapshot Seconds [DomSnapSec] — Default: 2 — Controls how often DOM data is captured in REAL DOM mode. Recommended: 1–2.

A smaller value captures more detail but can use more computer resources.

🔹 DOM History [DomHistory] — Default: 300 — Controls the number of DOM snapshots displayed on the heatmap. Recommended: 200–300.

🔹 Liquidity Wall Multiplier [WallMult] — Default: 3.0 — Determines how large an order must be to be considered a liquidity wall. Recommended: 3.0–4.0.

Higher values show fewer liquidity walls. Lower values show more.

Simple Idea: REAL DOM uses available order-book data. If usable DOM data is not available, the indicator calculates liquidity from market data.

🔢 Estimated Liquidity Map

These settings control how the indicator calculates estimated liquidity.

🔹 Map Bars [MapBars] — Default: 300 — Controls how many bars are used to build the liquidity map. Recommended: 300.

Higher values use more historical data. Lower values make the map more focused on recent price action.

🔹 Pivot Length [PivLen] — Default: 3 — Controls how swing highs and swing lows are detected. Recommended: 2–3 for scalping and 5+ for swing trading.

🔹 ATR Length [AtrLen] — Default: 14 — Controls the ATR calculation used for map spacing and ATR-based distances. Recommended: 14.

🔹 Row ATR [RowATR] — Default: 0.05 — Controls the size of each price row on the liquidity map. Recommended: 0.05.

A smaller value creates a finer map. A larger value creates fewer, wider levels.

🔹 Stop Cluster Weight [WStops] — Default: 1.0 — Controls the importance of stop-loss liquidity around swing highs and lows. Recommended: 1.0.

🔹 High Volume Node Weight [WHvn] — Default: 1.0 — Controls the importance of high-volume areas. Recommended: 1.0.

🔹 Round Number Weight [WRound] — Default: 0.6 — Controls the importance of round-number price levels. Recommended: 0.6.

🔹 Daily Level Weight [WDaily] — Default: 0.8 — Controls the importance of previous day and week highs and lows. Recommended: 0.8.

🔹 Absorption Weight [WAbsorb] — Default: 1.0 — Controls the importance of absorption bars. Recommended: 1.0.

Simple Idea: The indicator combines swing levels, volume, round numbers, previous highs/lows, and absorption to estimate important liquidity areas.

🔢 Round Numbers & Liquidity Magnets

🔹 Round Step [RoundStep] — Default: 0 — Controls the distance between round-number levels. 0 means automatic calculation. Recommended: 0.

When set to 0, the indicator automatically selects the step based on the price.

Examples:

🔹 EURUSD Round Step — 0.005

🔹 XAUUSD Round Step — 5 or 10

🔹 US30 Round Step — 100

🔹 Top Magnets [TopMagnets] — Default: 3 — Controls how many important liquidity magnets are shown above and below the current price. Recommended: 3.

The dashboard can list up to three magnets on each side.

Simple Idea: Liquidity magnets are important price areas where the indicator detects concentrated liquidity.

🔢 Breakout Check

🔹 Breakout Volume Ratio [BreakVolX] — Default: 1.3 — Controls the base volume requirement for a REAL breakout. Recommended: 1.3.

Higher values require stronger volume and produce fewer REAL breakout signals.

Lower values make the breakout check more permissive.

🔹 Volume MA Length [VolLen] — Default: 20 — Controls the volume average used for breakout and absorption checks. Recommended: 20.

Simple Idea: The indicator checks volume before identifying a REAL breakout.

🔢 Display Settings

🔹 Theme [Theme] — Default: THEME_DARK — Controls the chart appearance. Recommended: THEME_DARK.

Available themes:

🔹 Theme Option — THEME_NONE — Keeps the existing chart colours.

🔹 Theme Option — THEME_DARK — Uses the dark theme.

🔹 Theme Option — THEME_MIDNIGHT — Uses the midnight theme.

🔹 Theme Option — THEME_LIGHT — Uses the light theme.

🔹 Restore Theme [RestoreTheme] — Default: true — Restores the original chart colours when the indicator is removed. Recommended: true.

🔹 Show Liquidity Strip [ShowStrip] — Default: true — Shows the liquidity heatmap strip on the right side of the chart. Recommended: true.

🔹 Strip Width [StripWidth] — Default: 90 — Controls the width of the liquidity strip in pixels. Recommended: 90.

🔹 Heatmap Width [HeatWidth] — Default: 220 — Controls the width of the DOM time heatmap in REAL DOM mode. Recommended: 220 or higher`.

The setting is not used for the Estimated Liquidity Map.

🔹 Show Magnet Lines [ShowMagnetLines] — Default: true — Displays liquidity magnet lines, labels, and the VACUUM box. Recommended: true.

🔹 Label Font [LabelFont] — Default: 8 — Controls the font size of magnet and VACUUM labels. Recommended: 8.

🔢 Dashboard

🔹 Show Dashboard [ShowDash] — Default: true — Shows the information dashboard. Recommended: true.

🔹 Dashboard Position [DashRight] — Default: false — Places the dashboard on the left or right side of the chart. Recommended: false.

When false, the dashboard starts from the top-left.

When true, the dashboard uses the top-right side.

🔹 Dashboard X Position [DashX] — Default: 10 — Controls the horizontal dashboard position.

🔹 Dashboard Y Position [DashY] — Default: 28 — Controls the vertical dashboard position.

🔹 Dashboard Scale [DashScale] — Default: 1.5 — Controls the dashboard size. Recommended: 1.5.

🔹 Dashboard Font Adjustment [DashFontAdj] — Default: 1.0 — Controls dashboard text size. Recommended: 1.0.

The dashboard can also be moved by dragging its header.

Simple Idea: If the dashboard is too large, reduce DashScale. If the text is too small, increase DashFontAdj.

🔢 Alerts

🔹 Popup Alert [AlertPopup] — Default: true — Shows standard MT5 alert messages. Recommended: true.

🔹 Push Notification [AlertPush] — Default: false — Sends alerts to the MT5 mobile application. Recommended: false unless mobile alerts are needed.

🔹 Sound Alert [AlertSoundOn] — Default: false — Plays a sound when an alert occurs. Recommended: false or true depending on preference.

🔹 Alert Sound File [AlertSoundFile] — Default: alert.wav — Selects the sound file used for alert sounds. Recommended: alert.wav.

🔢 Alert Events

🔹 Magnet Alert [AlertMagnet] — Default: true — Alerts when price touches a liquidity magnet. Recommended: true.

🔹 Breakout Alert [AlertBreak] — Default: true — Alerts when a breakout condition is detected. Recommended: true.

This alert can cover both REAL and EMPTY breakout alerts. The message includes volume information and liquidity at the level.

🔹 Liquidity Wall Alert [AlertWall] — Default: true — Alerts when a REAL DOM liquidity wall appears or is pulled. Recommended: true.

These alerts are available when REAL DOM data is being used.

Alerts are generated for live bars only and do not create historical alerts.

🔢 Telegram

🔹 Enable Telegram [TgEnable] — Default: false — Sends indicator alerts to Telegram. Recommended: false unless Telegram alerts are needed.

🔹 Telegram Bot Token [TgToken] — Default: "" — Stores the Telegram bot token.

🔹 Telegram Chat ID [TgChatID] — Default: "" — Stores the Telegram chat, group, or channel ID.

Telegram setup:

🔹 Step 1 — Create a Telegram bot using @BotFather.

🔹 Step 2 — Start the bot or add it to the required group.

🔹 Step 3 — Enter the bot token in TgToken.

🔹 Step 4 — Enter the chat ID in TgChatID.

🔹 Step 5 — Set TgEnable = true.

🔹 Step 6 — Enable DLL imports.

🔹 Step 7 — Use TEST TG to test the connection.

🔢 About

🔹 Website [AboutWeb] — Default: https://eafxstore.com — Opens the EAFXSTORE website.

🔹 Telegram [AboutTelegram] — Default: https://t.me/eafxstore6789 — Opens the EAFXSTORE Telegram channel.

🔢 Quick Presets

🔶 Scalping

Recommended timeframe: M1–M5

🔹 Map Bars [MapBars] — 200

🔹 Pivot Length [PivLen] — 2

🔹 Breakout Volume Ratio [BreakVolX] — 1.5

🔹 Top Magnets [TopMagnets] — 2

🔶 Intraday

Recommended timeframe: M5–H1

🔹 General Setup — Use the default settings.

🔶 Swing Trading

Recommended timeframe: H4–D1

🔹 Map Bars [MapBars] — 400–500

🔹 Pivot Length [PivLen] — 5

🔹 Row ATR [RowATR] — 0.08–0.10

🔹 Daily Level Weight [WDaily] — 1.0

🔹 Breakout Volume Ratio [BreakVolX] — 1.2

🔶 Gold & Indices

Recommended timeframe: M5–H1

🔹 Round Step for Indices [RoundStep] — 50 or 100

🔹 Round Step for Gold [RoundStep] — 5 or 10

🔹 Round Number Weight [WRound] — 0.8

🔶 REAL DOM Broker

Recommended timeframe: M1–M15

🔹 Liquidity Mode [LqMode] — Auto

🔹 DOM Snapshot Seconds [DomSnapSec] — 1–2

🔹 DOM History [DomHistory] — 200

🔹 Heatmap Width [HeatWidth] — 220 or more

🔹 Liquidity Wall Multiplier [WallMult] — 3–4

🔶 Many Charts / Slow Computer

🔹 Bars to Calculate [MaxBarsCalc] — 1500

🔹 Liquidity Mode [LqMode] — Estimated only

🔹 Dashboard Scale [DashScale] — 1.0

🔢 Simple Liquidity Map Logic

The indicator works through several simple steps.

🔹 Step 1 — Select Data — Uses REAL DOM when usable DOM data is available. Otherwise, it calculates an Estimated Liquidity Map.

🔹 Step 2 — Find Liquidity — Looks for swing highs, swing lows, stop clusters, high-volume areas, absorption, round numbers, and previous day/week levels.

🔹 Step 3 — Build the Map — Combines the detected areas into liquidity levels and magnets.

🔹 Step 4 — Watch Price — Monitors how price moves around the detected liquidity areas.

🔹 Step 5 — Check Breakouts — Uses volume to check whether a breakout meets the REAL breakout conditions.

🔹 Step 6 — Send Alerts — Can alert when price touches a magnet, a breakout occurs, or a REAL DOM liquidity wall appears or is pulled.

🔢 Troubleshooting

🔶 Licence Error

🔹 Problem — “Please enter your licence key.”

🔹 Solution — Enter the licence key in InpLicenseKey.

🔶 DLL Error

🔹 Problem — “Please tick Allow DLL imports...”

🔹 Solution — Enable Allow DLL imports in MT5 and in the indicator settings.

🔶 Licence Server Error

🔹 Problem — “Cannot reach the licence server.”

🔹 Solution — Check the internet connection and firewall. The normal grace period can continue while the server is temporarily unavailable.

🔶 System Clock Error

🔹 Problem — “System clock check failed...”

🔹 Solution — Check and correct the Windows date and time.

🔶 Nothing Is Drawn

🔹 Check Licence — Make sure the licence has been verified.

🔹 Check Experts Tab — Look for error messages.

🔹 Check History — Make sure enough historical data is available.

🔹 Scroll the Chart Back — More historical bars may be required for the map.

🔶 Map Always Shows ESTIMATED

🔹 Cause — The broker may not provide usable DOM data with volume.

🔹 Solution — This is normal for many Forex and CFD brokers. The Estimated Liquidity Map can continue to be used.

🔶 Telegram Does Not Work

🔹 Check Bot Token — Make sure TgToken is correct.

🔹 Check Chat ID — Make sure TgChatID is correct.

🔹 Start the Bot — The Telegram bot must be started or added to the required group.

🔹 Check DLL Imports — DLL imports must be enabled.

🔹 Check Experts Tab — MT5 can show the reason for a failed Telegram connection.

🔶 Dashboard Is in the Wrong Position

🔹 Move Dashboard — Drag the dashboard header to the desired position.

🔹 Reset Dashboard Position — The saved dashboard position can override DashRight, DashX, and DashY.

🔶 Chart Colours Changed

🔹 Use Original Colours — Set Theme = THEME_NONE.

🔹 Restore Colours Automatically — Keep RestoreTheme = true.

🔢 Recommended Starting Settings

For a simple starting setup, the following settings can be used:

🔹 Bars to Calculate [MaxBarsCalc] — 3000

🔹 Liquidity Mode [LqMode] — Auto

🔹 Map Bars [MapBars] — 300

🔹 Pivot Length [PivLen] — 3

🔹 ATR Length [AtrLen] — 14

🔹 Row ATR [RowATR] — 0.05

🔹 Top Magnets [TopMagnets] — 3

🔹 Breakout Volume Ratio [BreakVolX] — 1.3

🔹 Volume MA Length [VolLen] — 20

🔹 Show Liquidity Strip [ShowStrip] — true

🔹 Show Magnet Lines [ShowMagnetLines] — true

🔹 Show Dashboard [ShowDash] — true

🔹 Magnet Alert [AlertMagnet] — true

🔹 Breakout Alert [AlertBreak] — true

🔹 Liquidity Wall Alert [AlertWall] — true

These settings provide a simple starting configuration with the main liquidity map, magnet, breakout, dashboard, and alert features enabled.

Full review

Quick Verdict

Omega Liquidity Map Indicator MT5 gives traders a visual map of potential liquidity above and below price. It combines real DOM or estimated liquidity data with magnets vacuum zones breakout validation and a Liquidity Score to create a structured view of where price may react or move next.

Best For

✅ Traders studying liquidity based price movement and order flow concepts.

✅ Forex gold indices and CFD traders using MetaTrader 5.

✅ Intraday traders looking for potential liquidity targets and breakout confirmation.

✅ Traders who want real DOM analysis when their broker provides market depth.

✅ Traders who need an estimated liquidity map when real order book data is unavailable.

Overall Rating

8.9/10 ⭐⭐⭐⭐⭐


What is Omega Liquidity Map Indicator MT5?

Omega Liquidity Map is a MetaTrader 5 indicator that identifies areas where liquidity may be concentrated above and below the current market price. It analyzes factors such as stops beyond swing points, high volume nodes, round numbers, previous day and week levels, and absorption to build a measurable liquidity map.

A key feature is its automatic data source detection. When real Depth of Market data is available, the indicator can build a genuine order book heatmap. When a broker does not provide usable DOM data, it switches to an estimated liquidity model based on price and tick volume behavior.

⭐ Join Our Channel Telegram


How Does Omega Liquidity Map Indicator MT5 Work?

Automatic Data Source Detection

When the indicator starts, it checks the broker market depth for usable volume levels. Four or more volume carrying price levels activate REAL DOM mode.

Otherwise, the indicator uses ESTIMATED mode. The check repeats every 30 seconds, allowing the indicator to change modes automatically if market depth becomes available or disappears.

Price Grid Construction

The indicator divides the market into horizontal price rows. Row height is calculated from ATR and the RowATR setting, while the grid covers the recent high low range plus additional ATR space above and below. Liquidity scores, magnets, vacuum zones and DOM information all use this common price grid.

Estimated Liquidity Mapping

In estimated mode, every price row receives a liquidity score from five main components.

These include stops beyond swing points, high volume nodes, round numbers, daily and weekly levels, and absorption. The combined result is normalized so the strongest row reaches 100 percent.

Liquidity Magnet Detection

Liquidity magnets are local peaks in the liquidity profile. The indicator selects important liquidity areas above and below price and displays their strength together with the main factors responsible for the level.

Liquidity Vacuum Detection

Low liquidity areas are identified as continuous bands where the liquidity score remains below the configured threshold.

When the zone is large enough, it is displayed as a VACUUM box. These areas represent zones where there may be less liquidity to slow price movement.

Breakout Validation

When price crosses a previously identified liquidity magnet, the indicator checks volume and follow through.

A move that satisfies the required conditions is classified as a REAL breakout. If the required volume or price extension is missing, it is classified as an EMPTY breakout, which may indicate a trap or failed move.

Real DOM Analysis

When genuine order book data is available, the indicator captures DOM snapshots and displays them as a time and price heatmap.

It also monitors large liquidity walls and pulled walls, providing additional information about changing order book conditions.


Key Features of Omega Liquidity Map Indicator

Automatic Liquidity Source Detection

The indicator automatically determines whether usable real DOM data exists and switches between REAL DOM and ESTIMATED liquidity analysis without requiring constant manual changes.

Liquidity Heatmap

A heatmap strip is displayed on the right side of the chart, showing the relative liquidity score of each price row. This creates a quick visual reference for areas where liquidity may be concentrated.

Liquidity Magnets

The indicator identifies important liquidity concentrations above and below price and labels each magnet with its strength and the main reasons behind its formation.

Liquidity Vacuum Zones

Low liquidity areas are displayed as VACUUM boxes, highlighting regions where price may move more rapidly because less liquidity is available to slow the market.

Breakout Validator

The breakout validator evaluates volume and price follow through to distinguish REAL breakouts from EMPTY breakouts that may represent traps.

Real DOM Heatmap

For brokers providing suitable market depth, the indicator displays historical DOM snapshots together with current order sizes, liquidity walls and pulled walls.

Liquidity Score Dashboard

The dashboard presents the overall Liquidity Score, directional bias, nearest magnets, vacuum status, DOM imbalance, recent breakouts and recent liquidity events in one interface.

Multi Channel Alerts

Alerts can be delivered through popup messages, MT5 mobile push notifications, sound and Telegram. Events include magnet reaches, real or empty breakouts, and DOM liquidity walls appearing or being pulled.


Omega Liquidity Map Indicator Review

Omega Liquidity Map Indicator MT5 focuses on one important part of market analysis: identifying where liquidity may be concentrated and how price interacts with those areas. Instead of relying on a single liquidity concept, the indicator combines several measurable components into a unified map.

The estimated mode is particularly important for retail forex and CFD traders because many brokers do not provide a usable real order book. In this situation, the indicator uses price and tick volume behavior to estimate liquidity concentrations. When real DOM is available, the system can instead display actual order book information.

The breakout validator adds another useful layer. Rather than treating every break of a liquidity level in the same way, it checks volume and price extension before classifying the event. This can help traders distinguish stronger breakouts from moves that lack sufficient follow through.

The dashboard also keeps the main information accessible without requiring traders to inspect every individual chart object. Liquidity Score, nearest magnets, vacuum conditions, DOM imbalance and recent events are organized into a single view.

Omega Liquidity Map Indicator Reviews
Omega Liquidity Map Indicator Review

Omega Liquidity Map Indicator Review

Simple BUY and SELL Entry Strategy

For beginners, the Omega Liquidity Map Indicator can be used with a simple liquidity reaction strategy. The main idea is to identify important liquidity areas on the chart, wait for price to reach or sweep one of these zones, and then look for a clear reversal confirmation before entering.

BUY Entry

🔹 Step 1: Identify a visible liquidity zone below the current price, such as an area around previous lows where sell-side liquidity may be concentrated.

🔹 Step 2: Wait for price to move into or briefly sweep the liquidity zone.

🔹 Step 3: Look for a bullish reaction after the liquidity sweep, such as a strong bullish candle or a break above a nearby short-term high.

🔹 Step 4: Enter a BUY position after the bullish confirmation candle closes.

🔹 Stop Loss: Place the Stop Loss below the liquidity zone or below the lowest point created during the liquidity sweep.

🔹 Take Profit: Target the next liquidity zone above price, previous high, or nearby resistance, using a predefined risk-to-reward ratio such as 1:2.

SELL Entry

🔹 Step 1: Identify a visible liquidity zone above the current price, such as an area around previous highs where buy-side liquidity may be concentrated.

🔹 Step 2: Wait for price to move into or briefly sweep the liquidity zone.

🔹 Step 3: Look for a bearish reaction after the liquidity sweep, such as a strong bearish candle or a break below a nearby short-term low.

🔹 Step 4: Enter a SELL position after the bearish confirmation candle closes.

🔹 Stop Loss: Place the Stop Loss above the liquidity zone or above the highest point created during the liquidity sweep.

🔹 Take Profit: Target the next liquidity zone below price, previous low, or nearby support, using a predefined risk-to-reward ratio such as 1:2.

Simple Entry Rule for Beginners

The basic rule is:

BUY = Sell-Side Liquidity Sweep + Bullish Reaction + Confirmation

SELL = Buy-Side Liquidity Sweep + Bearish Reaction + Confirmation

Avoid entering a trade simply because price reaches a liquidity zone. A liquidity area shows where price may react, but it is not automatically a BUY or SELL signal. Waiting for the sweep and a clear directional confirmation can help beginners avoid entering too early.

This simple method makes the Omega Liquidity Map Indicator easier to understand and apply. More advanced traders can later combine liquidity zones with market structure, Fair Value Gaps (FVG), Break of Structure (BOS), and other Smart Money Concepts.

Omega Liquidity Map Indicator MT5 Review

Omega Liquidity Map Indicator MT5 Review

Why Omega Liquidity Map Indicator Stands Out

Real DOM and Estimated Liquidity

The indicator supports two different liquidity data approaches. Real DOM is used when the broker provides suitable market depth, while estimated liquidity analysis is available for brokers without usable order book information.

Multi Factor Liquidity Analysis

Liquidity is not based on a single calculation. The estimated map combines swing stop areas, high volume nodes, round numbers, previous day and week levels and absorption.

Transparent Liquidity Sources

Each liquidity magnet includes information about the main components contributing to its strength. This makes the displayed levels easier to understand instead of presenting unexplained zones.

Breakout Quality Filtering

The breakout validator evaluates both volume and price extension, creating a distinction between REAL and EMPTY breakouts.

Fast Move Awareness

VACUUM zones identify areas with relatively low liquidity. These zones can provide additional context when price begins moving rapidly through the market.

Order Book Monitoring

Real DOM mode can identify large liquidity walls and pulled walls, giving traders additional information about changes in displayed market depth.

Practical Dashboard

The dashboard organizes liquidity source, directional pull, Liquidity Score, nearest magnets, vacuum status, DOM imbalance, breakout information and recent events in one place.

Efficient Chart Processing

MaxBarsCalc controls the amount of historical data processed, while the indicator updates chart objects efficiently and avoids unnecessary redraws.


Risk Management Features

Liquidity Based Take Profit Areas

The nearest liquidity magnet in the direction of a trade can be considered as a potential target because these areas represent concentrations that may attract price.

Stop Placement Awareness

Liquidity magnets on the opposite side of price can represent areas where stops may be concentrated. The product recommendations therefore advise avoiding stop placement directly at such zones when appropriate.

Breakout Confirmation

The REAL and EMPTY breakout classifications provide additional information before traders decide whether to follow a breakout or remain cautious.

Vacuum Risk Awareness

Price can move quickly through low liquidity areas. Recognizing VACUUM zones can therefore help traders account for potentially faster market movement and adjust position sizing accordingly.

Multi Factor Context

The Liquidity Score combines several inputs into one directional reading, but the product description recommends using it together with an independent trend or entry method rather than treating it as a standalone trading signal.


The default settings are intended for intraday trading from M5 to H1. RowATR is particularly important because a smaller value produces a finer but potentially noisier map, while a larger value creates fewer and stronger liquidity levels.

For gold, the recommended starting point is M5 to H1 with RoundStep set to 5 or 10 while keeping the other default settings.

Trading Style Timeframe Recommended Settings Main Use
Scalping M1-M5 MapBars 200, PivLen 2, RowATR 0.05-0.08, BreakVolX 1.5, TopMagnets 2 Forex majors and Gold
Intraday M5-H1 MapBars 300, PivLen 3, RowATR 0.05, BreakVolX 1.3, TopMagnets 3 Default setup
Swing H4-D1 MapBars 400-500, PivLen 5, RowATR 0.08-0.10, WDaily 1.0, BreakVolX 1.2 Higher timeframe liquidity
Gold XAUUSD M5-H1 RoundStep 5 or 10, other defaults Liquidity mapping
Stock Indices M5-H1 Set RoundStep such as 50 or 100, WRound 0.8 Index liquidity levels
Crypto M15-H4 WDaily 0.5, WHvn 1.2, BreakVolX 1.4 24 hour markets
Real DOM M1-M15 Mode Auto, DomSnapSec 1-2, DomHistory 200, WallMult 3-4 Order book analysis

Weaknesses and Risk Warnings

Estimated Liquidity Is Not Actual Order Flow

When real DOM is unavailable, liquidity is estimated from price and tick volume data.

It cannot reveal actual resting orders that the broker does not provide.

Real DOM Depends on the Broker

Real order book analysis requires a broker that supplies suitable volume-bearing market depth.

Without it, the indicator automatically falls back to estimated mode.

Liquidity Does Not Guarantee Price Reaction

A liquidity magnet identifies a potential concentration or attraction area, but price does not have to react from every displayed level.

EMPTY Breakouts Need Context

An EMPTY breakout can indicate a potential trap, but it should not automatically be treated as a reversal entry without additional confirmation.

Vacuum Zones Can Increase Speed

Low liquidity zones may allow price to travel faster. This can increase execution and risk considerations, particularly during volatile market conditions.

Settings Affect Map Quality

RowATR, MapBars, PivLen and the component weights influence the resulting liquidity map.

Settings that are too sensitive may create excessive levels, while broader settings can reduce detail.

Trading Risk

Omega Liquidity Map is an analytical tool and does not guarantee trading results.

Proper risk management and an independent trading plan remain necessary when using liquidity analysis in live markets.


Product Download Package?

The download package of the product suite includes:

✅ Indicator: OmegaLiquidityMap_v1.0.ex5

✅ Omega_Liquidity_Map_Inputs_Guide.pdf

✅ Omega_Liquidity_Map_Product_Guide.pdf

➡️ Reviewed by David Easton


Final Verdict

Omega Liquidity Map Indicator MT5 provides a comprehensive framework for studying where liquidity may be concentrated and how price interacts with those areas. Real DOM analysis, estimated liquidity mapping, liquidity magnets, vacuum zones, breakout validation and the Liquidity Score create a detailed market context on MetaTrader 5. Its flexible settings and multi channel alerts make it suitable for different trading styles, while the estimated mode allows liquidity analysis even when a broker does not provide a usable order book.

Questions about Omega Liquidity Map Indicator MT5

❓ What does Omega Liquidity Map do?

Omega Liquidity Map is a MetaTrader 5 indicator that identifies potential liquidity areas above and below price, including liquidity magnets, vacuum zones, and breakout conditions.

❓ How does Omega Liquidity Map detect liquidity?

Omega Liquidity Map combines swing stops, high-volume nodes, round numbers, previous day and week levels, and absorption to build a measurable liquidity profile.

❓ Does Omega Liquidity Map use real market depth data?

Omega Liquidity Map automatically detects whether the broker provides a volume-bearing Depth of Market. It uses REAL DOM when available and switches to an estimated liquidity map otherwise.

❓ What are liquidity magnets in Omega Liquidity Map?

Liquidity magnets in Omega Liquidity Map are high-scoring areas that may attract price. Each magnet displays its strength, distance, and the main factors contributing to its liquidity score.

❓ What is a liquidity vacuum in Omega Liquidity Map?

A liquidity vacuum in Omega Liquidity Map identifies an area with very low estimated liquidity where price may move faster because there are fewer liquidity zones to slow the movement.

❓ How does Omega Liquidity Map validate breakouts?

Omega Liquidity Map compares the breakout candle's volume and price follow-through against the liquidity level to classify a move as a REAL breakout or an EMPTY breakout that may indicate a trap.

❓ What is the Liquidity Score in Omega Liquidity Map?

The Liquidity Score in Omega Liquidity Map ranges from 0 to 100 and combines magnet pull, DOM imbalance when available, and recent breakout information into a market bias.

❓ Can Omega Liquidity Map detect order-book walls?

When REAL DOM data is available, Omega Liquidity Map detects large liquidity walls and monitors pulled walls that disappear while price is nearby, helping identify potential order-book changes.

❓ Can Omega Liquidity Map send alerts?

Yes. Omega Liquidity Map supports popup, mobile push, sound, and Telegram alerts for magnet touches, breakouts, liquidity walls, and other detected liquidity events.

❓ Which markets and timeframes are suitable for Omega Liquidity Map?

Omega Liquidity Map supports different markets including Forex, gold, indices, stocks, and crypto, with recommended settings ranging from short-term scalping to swing trading.

Other products traders compare

From $25
Instant download
Choose option