Omega OrderFlow Delta Indicator MT5
Omega OrderFlow Delta IndicatorOmega OrderFlow Delta MT5 ReviewOmega OrderFlow Delta Indicator ReviewOmega OrderFlow Delta Indicator MT5 ReviewsOmega OrderFlow Delta Indicator MT5 Review
Updated 30 Sept 2026

Omega OrderFlow Delta Indicator MT5

Omega OrderFlow Delta Indicator combines Footprint, Delta, CVD, POC and imbalances to detect absorption, exhaustion and weak breakouts on MT5.

Buy now — $25Add to cart
Download link right after paymentLifetime licenceInstall guide includedFree updates to new versions
Pay with Visa · MastercardUSDT · BTC · ETHBinance Pay
Not sure it fits your broker or account?Ask a question
Optimize Settings

Recommended settings for Omega OrderFlow Delta Indicator MT5

🔢 Omega Order Flow Delta – Easy-to-Read Inputs Guide
Omega OrderFlow Delta Indicator MT5 Settings Panel
Omega OrderFlow Delta Indicator Settings Panel

Omega OrderFlow Delta Indicator Settings Panel

🔢 Installation

⚙️ Requirements

🔹 MetaTrader 5 — Requires MT5 with an active demo or live trading account.

🔹 Licence Key — A valid licence key from eafxstore.com is required.

🔹 Internet Connection — Required for licence verification. An offline grace period is supported.

🔹 Allow DLL imports — Required because the indicator uses Windows wininet.dll for licence/Telegram functions and shell32.dll for WEB / TELEGRAM buttons.

⚙️ Install the Indicator

🔹 Step 1 — Open MetaTrader 5 and go to File → Open Data Folder.

🔹 Step 2 — Copy the .ex5 indicator into MQL5Indicators.

🔹 Step 3 — If an .mq5 source file is provided, open it in MetaEditor and compile it.

🔹 Step 4 — Return to MT5, right-click Indicators in Navigator and select Refresh.

🔹 Step 5 — Go to Tools → Options → Expert Advisors and enable Allow DLL imports.

🔹 Step 6 — Drag Omega Order Flow Delta onto a chart and also enable Allow DLL imports on the Common tab.

🔹 Step 7 — Enter the licence key in InpLicenseKey and click OK.

🔹 Licence Check — Open the Experts tab and look for Licence: Licence OK.

🔹 Telegram WebRequest — No WebRequest URL needs to be added. Telegram uses WinINet directly.

⚙️ Common Licence Messages

🔹 “Please enter your licence key.” — InpLicenseKey is empty.

🔹 “Please tick Allow DLL imports...” — Enable DLL imports in the required MT5 settings.

🔹 “Cannot reach the licence server.” — Check the internet connection. The indicator can continue during the offline grace period if previously activated.

🔹 “System clock check failed...” — The computer clock was moved backwards. Correct the system date and time.

🔹 Automatic Licence Re-check — The licence is checked automatically and again when switching to another trading account.


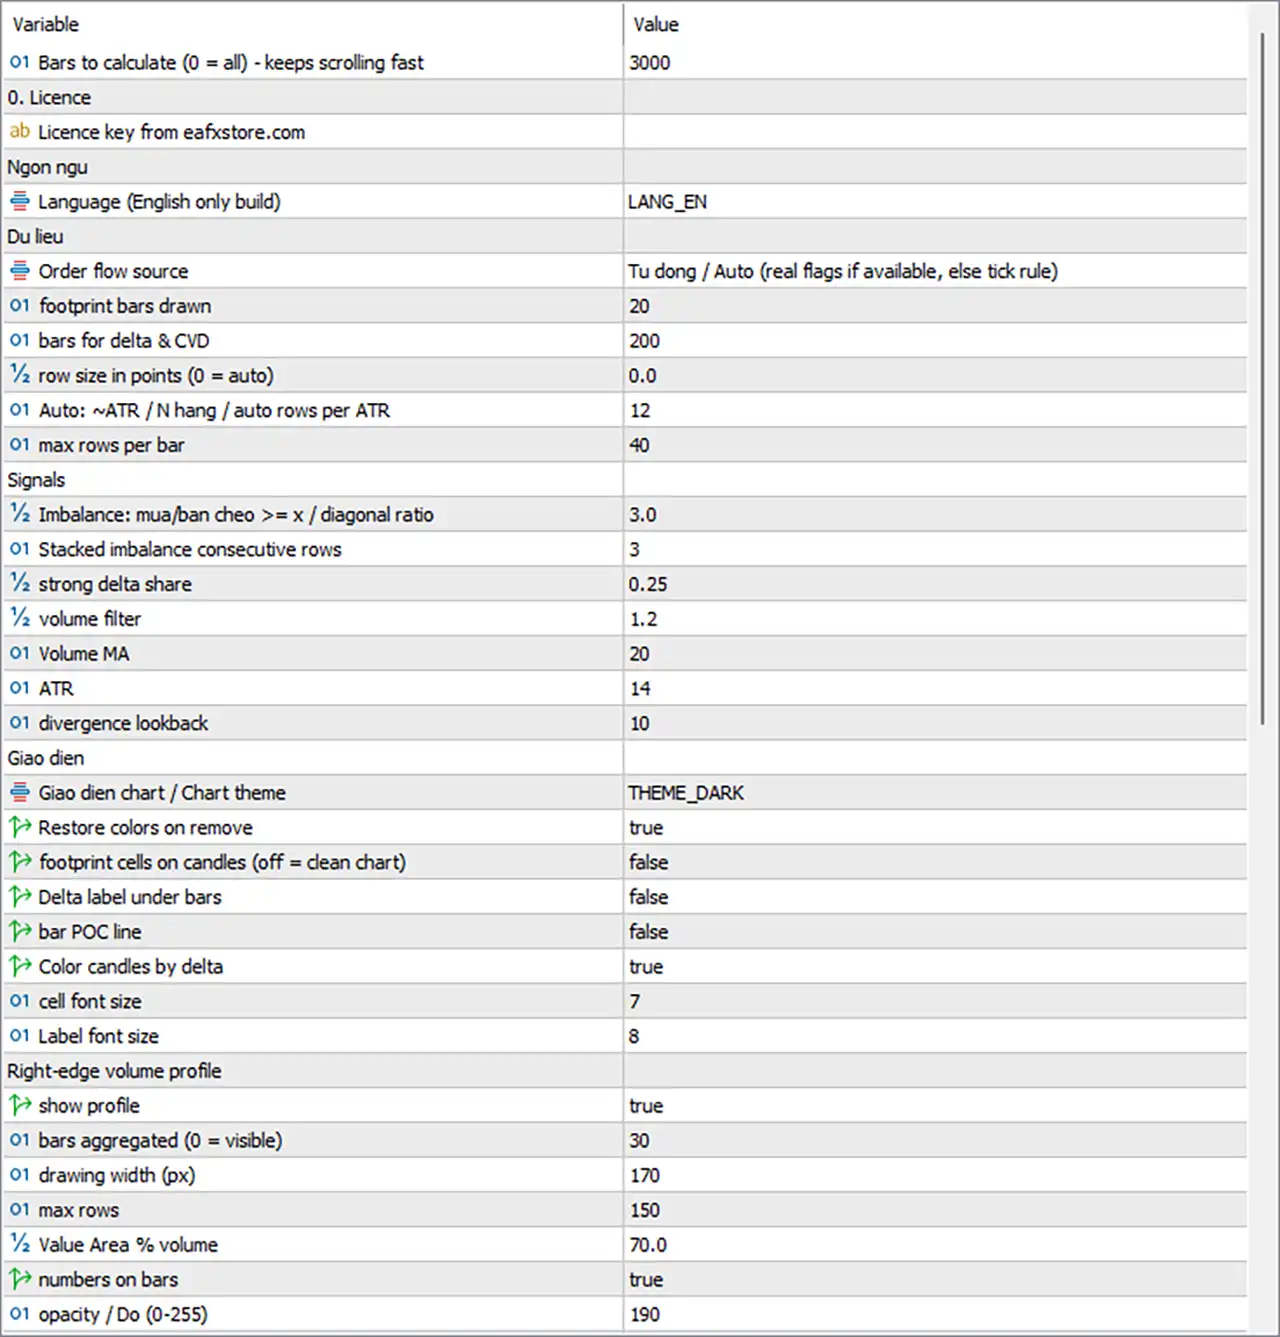
🔢 General & Licence

🔹 MaxBarsCalc — Default: 3000 — Maximum number of historical bars processed when the indicator loads. 0 = all bars. Recommended: 2000–5000 for faster loading and smooth scrolling.

🔹 InpLicenseKey — Default: (empty) — Licence key from eafxstore.com. Spaces around the key are removed and letters are converted to uppercase automatically. Required for the indicator to start.


🔢 Language

🔹 Lang — Default: LANG_EN — Controls the interface language. This build is English only, so dashboard labels and alerts remain in English. Recommended: keep LANG_EN.


🔢 Data

These settings control the order-flow data source and how each candle is divided into footprint price rows. They have a major effect on analysis detail and calculation speed.

⚙️ Order Flow Data

🔹 FlowMode — Default: Auto — Selects how BUY/SELL volume is classified.

🔹 Auto — Uses real BUY/SELL trade flags when the broker provides them. Otherwise, it uses the tick rule. Recommended: Auto.

🔹 Real trade flags only — Uses only broker-provided trade flags. On Forex, where such flags may not exist, bars fall back to the OHLC estimate.

🔹 Tick rule — Always classifies trades using price direction: uptick = BUY, downtick = SELL.


⚙️ Footprint History

🔹 FootprintBars — Default: 20 — Number of recent candles with footprint cells. Used only when ShowFootprint = true. Recommended: 10–30.

🔹 Higher FootprintBars — Provides more historical footprint detail but creates more chart objects.

🔹 CVDBars — Default: 200 — Number of recent bars calculated from real tick data for delta, footprint, imbalances and signals. Older bars use the faster OHLC estimate. Recommended: 150–300.

🔹 Higher CVDBars — Provides more detailed historical calculations but increases initial loading time.


⚙️ Footprint Row Size

🔹 RowPoints — Default: 0 — Controls the height of each footprint row in points. 0 = automatic calculation. Recommended: 0 unless fixed row sizes are required.

🔹 Automatic Row Size — Uses ATR divided by AutoRows, with the result never smaller than the symbol tick size.

🔹 Fixed Row Example — 10 points on EURUSD or 50 points on XAUUSD.

🔹 AutoRows — Default: 12 — Controls the number of automatic rows per ATR. Lower values create coarser rows; higher values create finer detail.

🔹 MaxRows — Default: 40 — Maximum number of rows allowed inside one candle. Very tall candles are capped to keep calculations fast.

Forex Data Tip

🔹 TICK RULE — Normal for Forex when real trade flags are unavailable.

🔹 OHLC ESTIMATE — Indicates that tick history is missing. Open the symbol, allow MT5 to download tick data and reload the indicator.


🔢 Signals

These settings control the sensitivity of the order-flow signals.

🔹 ImbRatio — Default: 3.0 — Diagonal imbalance ratio. A BUY imbalance occurs when buy volume at one row is at least ImbRatio × sell volume one row below. Recommended: 3.0.

🔹 ImbRatio 2.0–2.5 — Detects more imbalances.

🔹 ImbRatio 4.0+ — Detects only stronger imbalances.

🔹 StackMin — Default: 3 — Minimum consecutive imbalance rows required for a stacked imbalance. Recommended: 3; use 2 for higher sensitivity.

🔹 DeltaThr — Default: 0.25 — Strong delta threshold as a percentage of total volume. 0.25 = 25%. It is used for candle colouring and Absorption / Aggressive signals. Recommended: 0.25; use 0.30–0.35 for fewer, stronger signals.

🔹 VolMult — Default: 1.2 — Minimum volume multiplier required for Absorption, Exhaustion and Aggressive signals. Recommended: 1.2.

🔹 VolMult = 1.0 — Disables most volume filtering.

🔹 VolMult = 1.5 — Requires much higher-volume bars.

🔹 VolLen — Default: 20 — Number of bars used to calculate the moving average for the volume filter.

🔹 AtrLen — Default: 14 — ATR period used for automatic footprint row sizing together with AutoRows.

🔹 DivLook — Default: 10 — Lookback period for delta divergence. Price must make a new high or low while delta is weaker than half of the strongest delta in the lookback and CVD moves against price.


🔢 Display

🔹 Theme — Default: THEME_DARK — Controls the chart colour theme: NONE, DARK, MIDNIGHT or LIGHT. The theme also changes the chart to candlesticks.

🔹 RestoreTheme — Default: true — Restores the original chart colours when the indicator is removed. Recommended: true.

🔹 ShowFootprint — Default: false — Displays BUY × SELL footprint cells on the latest FootprintBars candles. Recommended: false for a clean chart; true for detailed order-flow analysis.

🔹 ShowDeltaText — Default: false — Displays delta information under footprint bars, such as +1.2k 3/1. Requires ShowFootprint = true.

🔹 ShowPOC — Default: false — Draws a gold Point of Control (POC) line on each footprint bar. Requires ShowFootprint = true.

🔹 ColorByDelta — Default: true — Recolours candles with strong delta. Lime indicates strong buying and red indicates strong selling.

🔹 CellFont — Default: 7 — Font size of numbers inside footprint cells. Increase on high-resolution screens.

🔹 LabelFont — Default: 8 — Font size of delta labels below footprint bars.


🔢 Right-Edge Volume Profile

🔹 ShowProfile — Default: true — Displays the BUY/SELL volume profile on the right side of the chart. Recommended: true.

🔹 ProfileBars — Default: 30 — Number of recent candles aggregated into the volume profile.

🔹 ProfileBars = 0 — Uses all currently visible chart bars. The profile changes when scrolling or zooming.

🔹 ProfileWidth — Default: 170 — Width of the volume profile area in pixels. Minimum: 60.

🔹 ProfileMaxRows — Default: 150 — Maximum number of price rows in the profile. Row size increases automatically when the price range is large.

🔹 ProfileVA — Default: 70 — Percentage of volume included in the Value Area around the POC. 70 is the standard market-profile value.

🔹 ProfileNumbers — Default: true — Displays SELL × BUY numbers on profile rows when enough space is available.

🔹 ProfileAlpha — Default: 190 — Controls profile bar opacity. Effective range: 40–255. Lower values allow candles to remain more visible.


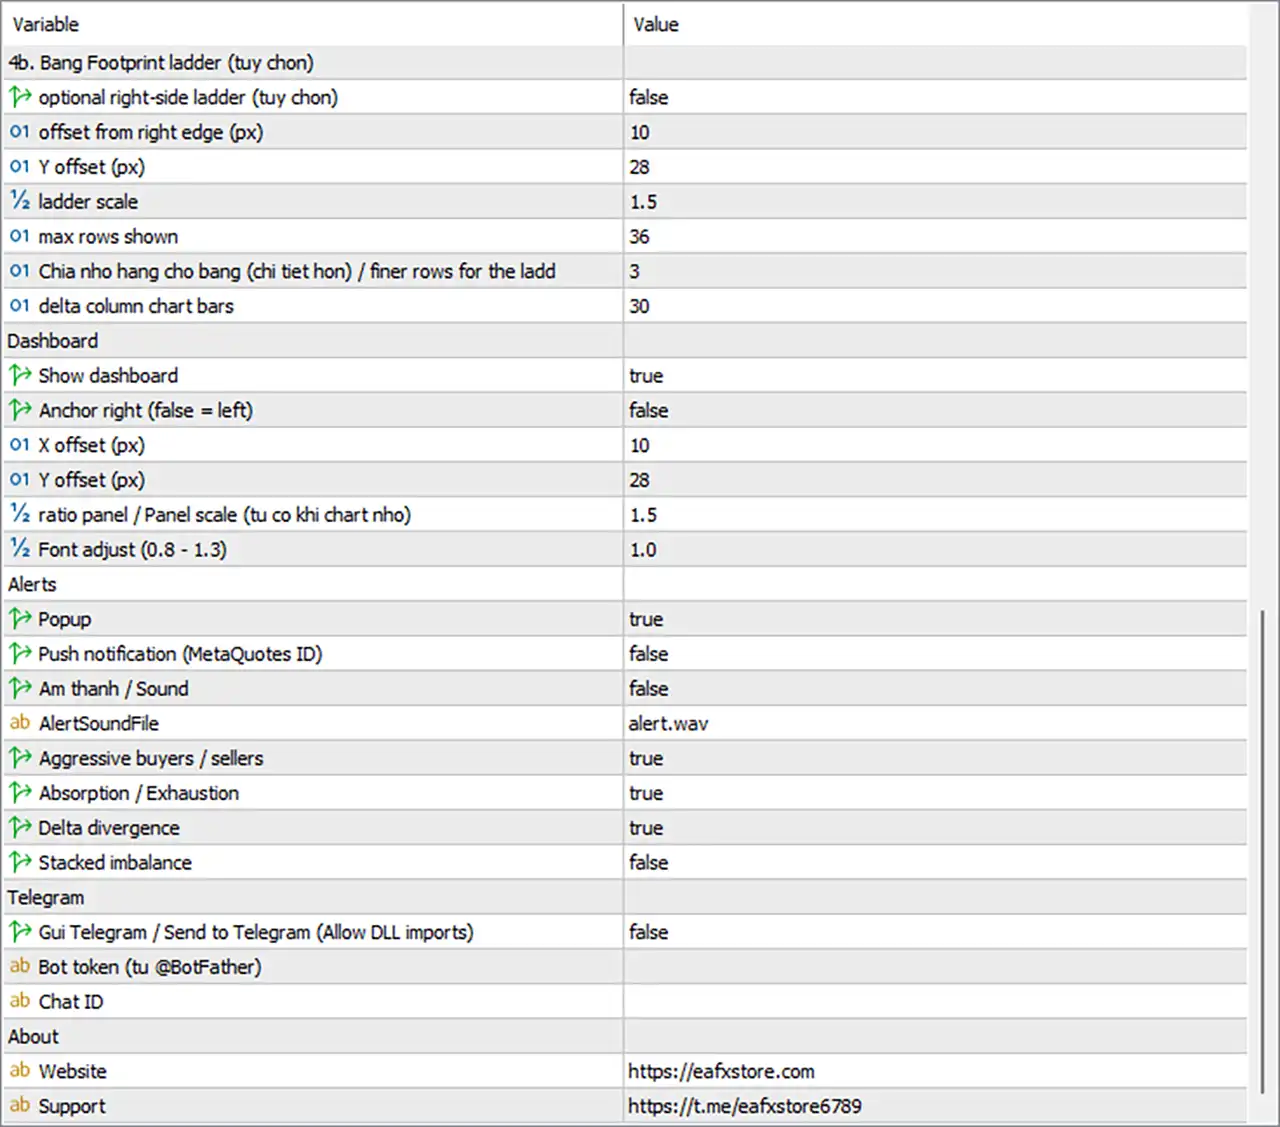
🔢 Footprint Ladder Panel

The Footprint Ladder Panel provides detailed row-by-row order-flow information for one selected candle.

🔹 ShowLadder — Default: false — Shows the footprint ladder for one candle. < > buttons browse previous candles and LIVE returns to the current candle.

🔹 LadderX — Default: 10 — Distance of the ladder panel from the right edge of the chart in pixels.

🔹 LadderY — Default: 28 — Distance from the top of the chart in pixels.

🔹 LadderScale — Default: 1.5 — Controls ladder panel size. It automatically reduces on small charts and remains approximately within 35% of chart width.

🔹 LadderRows — Default: 36 — Maximum number of rows displayed in the ladder. Additional rows are merged.

🔹 LadderRowDiv — Default: 3 — Divides the normal row size by this value, creating finer ladder detail. 1 = same row size as the main footprint.

🔹 DeltaBars — Default: 30 — Number of bars displayed in the delta column chart at the bottom of the ladder.

🔹 Panel Position — Drag the ladder by its header. The new position is remembered for that chart and overrides LadderX / LadderY.


🔢 Dashboard

🔹 ShowDash — Default: true — Shows the main dashboard panel.

🔹 DashRight — Default: false — Places the dashboard on the right side instead of the left.

🔹 DashX — Default: 10 — Horizontal distance from the selected chart edge in pixels.

🔹 DashY — Default: 28 — Vertical distance from the top of the chart in pixels.

🔹 DashScale — Default: 1.5 — Controls overall dashboard size. The panel automatically shrinks when necessary. Minimum scale: 0.55.

🔹 Laptop Screens — Use approximately 1.0–1.2.

🔹 Large / 4K Screens — Use approximately 1.5–2.0.

🔹 DashFontAdj — Default: 1.0 — Adjusts dashboard text size independently from panel size. Recommended: 0.8–1.3.

🔹 Dashboard Position — Drag the dashboard by its header to reposition it. The new position is remembered for that chart and overrides DashX / DashY.


🔢 Alerts

Alerts are generated only when a new bar closes with a signal in real time. Historical bars do not generate alerts when the indicator first loads.

🔹 AlertPopup — Default: true — Displays the MetaTrader alert window with sound.

🔹 AlertPush — Default: false — Sends notifications to the MT5 mobile application. A MetaQuotes ID must be configured under Tools → Options → Notifications.

🔹 AlertSoundOn — Default: false — Plays a sound file for each alert in addition to the popup.

🔹 AlertSoundFile — Default: alert.wav — Sound file located in the MetaTrader Sounds folder.

🔹 AlertAggr — Default: true — Alerts for Aggressive Buyers / Sellers signals.

🔹 AlertAbsorb — Default: true — Alerts for Absorption and Exhaustion signals.

🔹 AlertDiverg — Default: true — Alerts for Delta Divergence signals.

🔹 AlertStack — Default: false — Alerts for stacked imbalance signals. Recommended: false initially because stacked imbalances can occur frequently in active markets.


🔢 Telegram

🔹 TgEnable — Default: false — Sends indicator alerts to Telegram. Requires Allow DLL imports.

🔹 TEST TG — Appears on the dashboard when Telegram is enabled.

🔹 TgToken — Default: (empty) — Telegram bot token obtained from @BotFather.

🔹 TgChatID — Default: (empty) — Chat, group or channel ID that receives Telegram messages. Group and channel IDs commonly start with -100.

Telegram Setup

🔹 Step 1 — Open @BotFather in Telegram and send /newbot.

🔹 Step 2 — Choose the bot name and copy the generated token into TgToken.

🔹 Step 3 — Open the new bot and press Start, or add it to the required group/channel as an administrator.

🔹 Step 4 — Obtain the Chat ID and enter it into TgChatID.

🔹 Step 5 — Set TgEnable = true and click OK.

🔹 Step 6 — Press TEST TG on the dashboard.

🔹 Troubleshooting — If no test message arrives, check the Experts tab for the error.


🔢 About

🔹 AboutWeb — Default: https://eafxstore.com — Website opened by the WEB button on the dashboard.

🔹 AboutTelegram — Default: https://t.me/eafxstore6789 — Support page opened by the TELEGRAM button.


🔢 Quick Setup Presets

⚙️ Clean Chart — Signals Only

🔹 ShowFootprint — false

🔹 ShowProfile — false

🔹 ShowDash — true

🔹 ColorByDelta — true

This setup keeps the chart clean while retaining the dashboard and delta-based candle colouring.


⚙️ Maximum Detail — Scalping

🔹 ShowFootprint — true

🔹 FootprintBars — 10

🔹 ShowPOC — true

🔹 ShowLadder — true

🔹 AutoRows — 8

This setup increases footprint detail for short-term order-flow analysis.


⚙️ Fewer but Stronger Signals

🔹 DeltaThr — 0.30–0.35

🔹 VolMult — 1.4–1.5

🔹 ImbRatio — 3.5–4.0

Higher thresholds require stronger delta, volume and imbalance conditions.


⚙️ More Signals

🔹 DeltaThr — 0.20

🔹 VolMult — 1.0–1.1

🔹 ImbRatio — 2.5

🔹 StackMin — 2

Lower thresholds make the indicator more sensitive to order-flow events.


⚙️ Faster Loading

🔹 CVDBars — 150

🔹 MaxBarsCalc — 2000

🔹 ProfileBars — 30

🔹 ShowFootprint — false

This configuration reduces historical calculation and chart-object load.


⚙️ Mobile / Remote Alerts

🔹 AlertPush — true

🔹 Alternative — Set TgEnable = true with a valid TgToken and TgChatID.


🔢 Simple Omega Order Flow Delta Logic

🔹 Step 1 — Select Data Source — FlowMode determines whether the indicator uses real trade flags or the tick-rule classification.

🔹 Step 2 — Build Footprint Rows — Each candle is divided into price rows using RowPoints or automatic ATR-based sizing through AutoRows.

🔹 Step 3 — Calculate BUY/SELL Volume — Volume is classified into buying and selling activity for each price row.

🔹 Step 4 — Calculate Delta — Delta represents the difference between BUY and SELL volume.

🔹 Step 5 — Detect Imbalances — ImbRatio identifies unusually strong BUY or SELL volume differences between neighbouring price rows.

🔹 Step 6 — Detect Stacked Imbalances — StackMin requires consecutive imbalance rows before a stacked imbalance signal is produced.

🔹 Step 7 — Detect Strong Delta — DeltaThr identifies candles where delta represents a significant portion of total volume.

🔹 Step 8 — Apply Volume Filter — VolMult and VolLen determine whether volume is high enough for certain order-flow signals.

🔹 Step 9 — Detect Divergence — DivLook checks for situations where price reaches a new extreme while delta and CVD fail to confirm the move.

🔹 Step 10 — Display Order Flow — The indicator can show footprint cells, POC, volume profile, ladder data and delta-based candle colours.

🔹 Step 11 — Generate Alerts — Alerts can be generated for Aggressive activity, Absorption, Exhaustion, Delta Divergence and Stacked Imbalance.


🔢 Recommended Starting Settings

Balanced Order Flow Setup

🔹 FlowMode — Auto

🔹 FootprintBars — 20

🔹 CVDBars — 200

🔹 RowPoints — 0

🔹 AutoRows — 12

🔹 MaxRows — 40

🔹 ImbRatio — 3.0

🔹 StackMin — 3

🔹 DeltaThr — 0.25

🔹 VolMult — 1.2

🔹 VolLen — 20

🔹 AtrLen — 14

🔹 DivLook — 10

🔹 ShowProfile — true

🔹 ProfileBars — 30

🔹 ProfileVA — 70

🔹 ShowDash — true

These settings preserve the source guide's default configuration and provide a balanced starting point for testing.


🔢 How to Adjust Signal Sensitivity

⚙️ When Too Many Signals Appear

🔹 DeltaThr — Increase toward 0.30–0.35.

🔹 VolMult — Increase toward 1.4–1.5.

🔹 ImbRatio — Increase toward 3.5–4.0.

🔹 StackMin — Increase if stacked imbalance alerts are too frequent.

⚙️ When Too Few Signals Appear

🔹 DeltaThr — Reduce toward 0.20.

🔹 VolMult — Reduce toward 1.0–1.1.

🔹 ImbRatio — Reduce toward 2.5.

🔹 StackMin — Reduce to 2.


🔢 Important Notes

🔹 Forex Data — TICK RULE is normal when the broker does not provide real trade flags.

🔹 OHLC ESTIMATE — Indicates that tick history is unavailable for older data.

🔹 Footprint Detail — Increasing FootprintBars, CVDBars, AutoRows or other detailed settings can increase calculation and chart-object load.

🔹 ShowFootprint — Creates many chart objects, so it is disabled by default for a cleaner and faster chart.

🔹 ShowProfile — Provides a right-edge BUY/SELL volume profile and follows the chart price scale.

🔹 Alerts — Historical bars do not trigger alerts when the indicator is initially loaded.

🔹 Telegram — Requires DLL imports and valid bot credentials.

🔹 Licence — The indicator requires a valid licence key and periodic online verification.
Full review

Quick Verdict

Omega OrderFlow Delta Indicator is a MetaTrader 5 order flow tool that combines footprint data, Delta, CVD, imbalances, POC, Value Area and five market pressure signals to help traders confirm entries and identify absorption, exhaustion and weak breakouts.

Best For

✅ Scalpers looking for real-time buying and selling pressure on lower timeframes.

✅ Day traders who need order flow confirmation around key price levels.

✅ Price action and SMC traders seeking volume-based confirmation.

✅ Traders analyzing breakouts, absorption and aggressive market participation.

✅ Users who want footprint, CVD, Alerts and order flow statistics inside MT5.

Overall Rating

9.0/10 ⭐⭐⭐⭐⭐


What is Omega OrderFlow Delta Indicator?

Omega OrderFlow Delta Indicator is a MetaTrader 5 order flow analysis tool that examines tick activity inside each candle to estimate buying and selling pressure. It builds a Bid × Ask footprint, calculates Delta and Cumulative Volume Delta, identifies diagonal imbalances, POC and Value Area, then combines recent order flow information into an Order Flow Score from 0 to 100.

Unlike a standard candlestick indicator that mainly shows price movement, Omega OrderFlow Delta focuses on the activity behind that movement. It can highlight aggressive buyers, aggressive sellers, absorption, exhaustion and delta divergence, giving traders additional information when evaluating potential market moves.

⭐ Join Our Channel Telegram


How Does Omega OrderFlow Delta Indicator Work?

Tick Based Order Flow Analysis

The indicator requests tick history for each bar and classifies the available data into buying and selling activity. Depending on the instrument and broker feed, it can use real trade flags, the tick rule or an OHLC based estimate.

For Forex and other OTC markets without real exchange trade flags, the indicator uses price changes to classify ticks. This means Forex order flow should be interpreted as a relative pressure proxy rather than actual exchange traded contract volume.

Footprint and Delta Calculation

Each candle is divided into horizontal price rows. Buying and selling volume is accumulated within each row to create a footprint structure. From this data, the indicator calculates total volume, Delta, maximum and minimum Delta, POC and Cumulative Volume Delta.

Positive Delta indicates stronger aggressive buying, while negative Delta indicates stronger aggressive selling. CVD then tracks the cumulative balance of Delta across closed bars to provide a broader view of order flow pressure.

Diagonal Imbalance Detection

Omega OrderFlow Delta compares buying and selling activity between adjacent price rows to detect diagonal imbalances. A buy imbalance occurs when buying volume at one row reaches the configured multiple of selling volume on the row below it, with the reverse condition used for sell imbalances.

Three or more consecutive imbalances form a stacked imbalance, which can highlight an area where aggressive market participation is concentrated.

Order Flow Signal Detection

The indicator evaluates signals after the candle closes, helping prevent historical signals from changing afterward. Only one primary signal is issued per bar, with volume requirements applied before the main signal checks are performed.

The five main order flow events are absorption, exhaustion, delta divergence, aggressive buyers or sellers and stacked imbalance. Each event represents a different relationship between price, volume and aggressive market participation.

Order Flow Score

The Order Flow Score combines CVD trend, current bar Delta and recent signals into a single value between 0 and 100. A score of 60 or higher is classified as bullish, while 40 or lower is classified as bearish. Values between these levels remain neutral.


Key Features of Omega OrderFlow Delta Indicator

Professional Footprint Display

The optional footprint view displays Sell × Buy information for individual price rows inside recent candles. Row intensity reflects volume while diagonal imbalances can be highlighted directly on the footprint.

Delta and Cumulative Delta

Delta measures the difference between buying and selling activity, while CVD tracks the cumulative balance over time. Together they provide both immediate and broader views of market pressure.

Five Order Flow Events

Absorption, exhaustion, delta divergence, aggressive buying or selling and stacked imbalance provide multiple ways to interpret changes in market participation. These events help distinguish strong price movement from moves that may be losing support.

POC and Value Area

The right-edge volume profile identifies the Point of Control and Value Area for the selected profile period. This creates additional volume-based reference levels for analyzing support, resistance and price acceptance.

Order Flow Score

The 0 to 100 Order Flow Score condenses CVD direction, current Delta and recent order flow signals into a simple market pressure reading. The dashboard labels conditions as bullish, neutral or bearish.

Interactive Footprint Ladder

The optional Footprint Ladder provides a detailed vertical view of one selected candle, including buying and selling activity, POC, imbalances and current price. Historical candles can be reviewed directly from the panel.

Multi Channel Alerts

New signals can trigger popup notifications, mobile push alerts, sounds or Telegram messages. Telegram alerts include the symbol, timeframe, signal name, Delta, price and time.


Omega OrderFlow Delta Indicator Review

Omega OrderFlow Delta Indicator brings a relatively advanced order flow workflow directly into MetaTrader 5. Instead of relying only on traditional oscillators, it combines price, tick activity, volume distribution and aggressive participation into a unified dashboard.

One of its strongest practical elements is the combination of footprint data with Delta and CVD. Traders can inspect individual price rows while also maintaining a broader view of whether buying or selling pressure is strengthening or weakening.

The five event types add another layer of interpretation. Absorption can highlight situations where aggressive buyers or sellers fail to move price effectively, while delta divergence can identify situations where price continues moving but order flow pressure deteriorates.

The right-edge profile also makes the indicator useful around important price areas. POC and Value Area provide volume-based reference points that can complement support, resistance, supply and demand or VWAP analysis.

Omega OrderFlow Delta Indicator MT5 Reviews
Omega OrderFlow Delta Indicator MT5 Review

Omega OrderFlow Delta Indicator MT5 Review

Simple BUY and SELL Entry Strategy

For beginners, the Omega OrderFlow Delta Indicator can be used with a simple buying and selling pressure approach. The main idea is to observe whether aggressive buyers or sellers are dominating the market, then wait for price confirmation before entering a trade.

BUY Entry

🔹 Step 1: Wait for the Omega OrderFlow Delta Indicator to show increasing or strongly positive Delta, indicating stronger aggressive buying pressure.

🔹 Step 2: Check that price is holding above a nearby support level or beginning to move upward with the positive Delta.

🔹 Step 3: Wait for a bullish confirmation candle to close while buying pressure remains supportive.

🔹 Step 4: Enter a BUY position after the bullish confirmation candle closes.

🔹 Stop Loss: Place the Stop Loss below the recent swing low or below the nearby support area.

🔹 Take Profit: Target the next resistance level or use a predefined risk-to-reward ratio such as 1:2.

SELL Entry

🔹 Step 1: Wait for the Omega OrderFlow Delta Indicator to show decreasing or strongly negative Delta, indicating stronger aggressive selling pressure.

🔹 Step 2: Check that price is holding below a nearby resistance level or beginning to move downward with the negative Delta.

🔹 Step 3: Wait for a bearish confirmation candle to close while selling pressure remains supportive.

🔹 Step 4: Enter a SELL position after the bearish confirmation candle closes.

🔹 Stop Loss: Place the Stop Loss above the recent swing high or above the nearby resistance area.

🔹 Take Profit: Target the next support level or use a predefined risk-to-reward ratio such as 1:2.

Simple Entry Rule for Beginners

The basic rule is:

BUY = Positive Delta + Support/Higher Price + Bullish Confirmation

SELL = Negative Delta + Resistance/Lower Price + Bearish Confirmation

Avoid entering a trade based only on a single Delta reading. Delta measures the difference between aggressive buying and selling activity, but a strong reading does not automatically guarantee that price will continue in the same direction. Waiting for price confirmation can provide a more structured entry.

This simple approach makes the Omega OrderFlow Delta Indicator easier for beginners to understand and apply. More advanced traders can later combine Delta with volume imbalance, absorption, cumulative Delta, market structure, or support and resistance.

Omega OrderFlow Delta MT5 Review

Omega OrderFlow Delta MT5 Review

Why Omega OrderFlow Delta Indicator Stands Out

Order Flow Inside MT5

Omega OrderFlow Delta brings footprint, Delta, CVD, imbalance and volume profile functionality directly into a standard MetaTrader 5 environment.

Clear Pressure Analysis

The combination of Delta and CVD makes it easier to distinguish simple price movement from changes in aggressive buying and selling pressure.

Absorption and False Breakout Detection

Absorption and delta divergence can reveal situations where price breaks a level without sufficient supporting pressure, providing additional information when evaluating breakout quality.

Volume Based Key Levels

POC, Value Area and stacked imbalance zones create additional market structure references based on volume distribution rather than price alone.

Non Repainting Signals

Signals are processed on closed bars, helping keep historical signals consistent with what would have been visible during live market conditions.

Unified Order Flow Dashboard

The dashboard combines current Delta, CVD change, imbalance counts, current footprint information, recent signals and the overall Order Flow Score in one interface.

Flexible Across Markets

The indicator supports different market data conditions through real trade flags, tick-based classification and an OHLC fallback. This allows the same framework to be applied to Forex, CFDs, futures, stocks and crypto CFDs.

Remote Signal Notifications

Popup, push, sound and Telegram alerts allow traders to receive newly generated order flow signals without continuously monitoring the chart.


Risk Management Features

Closed Bar Signal Confirmation

Signals are evaluated after a candle closes rather than being finalized from incomplete historical bars. This reduces the risk of relying on signals that later change.

Volume Qualification

Signals require above-average tick volume based on the configured volume multiplier and lookback period. This helps filter out some low-activity market conditions.

Market Pressure Confirmation

Delta, CVD, imbalance and order flow events provide additional confirmation before an entry is considered. The product description recommends treating these signals as confirmation around existing trading levels rather than independent entries.

Relative Forex Volume Interpretation

For Forex markets, the indicator explicitly treats order flow as a proxy based on price changes rather than centralized exchange volume. This distinction is important when interpreting Delta and other volume-related readings.

Performance Controls

CVDBars, ProfileBars and MaxBarsCalc can limit the amount of historical data processed. ShowFootprint can also be disabled to reduce processing requirements when necessary.


Omega OrderFlow Delta Indicator supports several trading styles, but the supplied settings recommend M5 to H1 as the general range for balancing order flow detail and market noise. M1 can produce very thin footprints, while higher timeframes require more tick history per candle.

Market Trading Timeframe Recommended Focus
Forex Majors M5 to M30 Tick-based Delta, support and resistance confirmation
Gold and Indices CFDs M5 to M30 Volatility, Delta and imbalance confirmation
Futures and Stocks M5 to H1 Real traded volume and footprint analysis
Crypto CFDs M5 to H1 Continuous order flow and volume profile analysis

For scalping, the recommended settings include CVDBars 300, AutoRows 8, ImbRatio 2.5, StackMin 2, DeltaThr 0.20 and VolMult 1.3.

For day trading, the default configuration uses CVDBars 200, AutoRows 12, ImbRatio 3.0, StackMin 3, DeltaThr 0.25 and VolMult 1.2.

For swing trading, the suggested configuration uses CVDBars 150, AutoRows 16, ImbRatio 3.0, StackMin 3, DeltaThr 0.30 and VolMult 1.1.


Weaknesses and Risk Warnings

Forex Volume Is a Proxy

Forex does not provide one centralized exchange order book comparable to many futures markets. The indicator therefore uses tick-based classification when real trade flags are unavailable. Delta values should be interpreted relatively rather than as exact traded contract volume.

Tick History Is Important

The indicator depends heavily on tick data. The recommended setup is to open the symbol in MT5 Market Watch and allow the terminal to download available tick history before evaluating results.

Higher Detail Requires More Processing

Footprint calculations and tick requests can increase processing requirements. Reducing CVDBars, ProfileBars and MaxBarsCalc can improve terminal responsiveness when necessary.

Signals Are Not Standalone Entries

The product description recommends using order flow signals as confirmation around existing levels such as support and resistance, supply and demand or VWAP. Order flow information should therefore be combined with a defined trading plan and risk controls.

No Profit Guarantee

Omega OrderFlow Delta Indicator is an analysis tool and does not guarantee trading profits. Leveraged trading carries significant risk, and historical signals cannot guarantee future results.


Who Should Use Omega OrderFlow Delta Indicator?

Scalpers

The indicator suits scalpers who want additional information about aggressive buying and selling activity on lower timeframes. The dedicated footprint, Delta and imbalance features provide detailed intrabar information.

Day Traders

Day traders can use the dashboard, CVD, Order Flow Score, POC and Value Area to evaluate market pressure and potential confirmation around important price levels.

Price Action Traders

Traders using support and resistance, supply and demand or VWAP can add order flow confirmation to their existing market structure analysis.

SMC Traders

SMC and price action approaches can benefit from additional information about whether a breakout or reaction at a key level is supported by aggressive participation.

Volume and Order Flow Traders

Users already familiar with footprint charts, Delta, CVD and volume profile can take advantage of the indicator's integrated dashboard and alert system without relying on separate analysis tools.


Product Download Package?

The download package of the product suite includes:

✅ Indicator: OmegaOrderFlowDelta_v1.0.ex5

✅ Omega_Order_Flow_Delta_Inputs_Guide.pdf

➡️ Reviewed by David Easton


Final Verdict

Omega OrderFlow Delta Indicator is a feature rich MetaTrader 5 order flow tool combining footprint analysis, Delta, CVD, diagonal imbalances, POC, Value Area and five market pressure events. Its closed bar signals, Order Flow Score, interactive dashboard and multi channel alerts make it suitable for scalping, day trading and confirmation based strategies. The main consideration is data quality, especially on Forex where order flow is a tick based proxy.

Questions about Omega OrderFlow Delta Indicator MT5

❓ What does Omega OrderFlow Delta Indicator do?

Omega OrderFlow Delta Indicator analyzes tick data to show buying and selling pressure through footprint data, bar delta, CVD, diagonal imbalances, POC, and volume profile.

❓ How does Omega OrderFlow Delta Indicator measure buying and selling pressure?

Omega OrderFlow Delta Indicator classifies tick activity as buying or selling using real trade flags, the tick rule, or an OHLC-based estimate when suitable tick data is unavailable.

❓ Does Omega OrderFlow Delta Indicator use real trading volume on Forex?

On Forex, Omega OrderFlow Delta Indicator uses a tick-based proxy because Forex does not provide centralized exchange volume. The values should therefore be interpreted relatively.

❓ What order flow signals does Omega OrderFlow Delta Indicator detect?

Omega OrderFlow Delta Indicator detects Absorption, Exhaustion, Delta Divergence, Aggressive Buyers/Sellers, and Stacked Imbalance events.

❓ What is the Order Flow Score in Omega OrderFlow Delta Indicator?

Omega OrderFlow Delta Indicator calculates a 0–100 Order Flow Score using CVD trend, current bar delta, and recent order flow signals to indicate bullish, bearish, or neutral conditions.

❓ Does Omega OrderFlow Delta Indicator provide footprint and volume profile analysis?

Yes. Omega OrderFlow Delta Indicator can display Bid × Ask footprint cells, POC, a right-edge volume profile, Value Area, diagonal imbalances, and an optional footprint ladder.

❓ Does Omega OrderFlow Delta Indicator repaint its signals?

No. Omega OrderFlow Delta Indicator evaluates signals only when candles close, so confirmed order flow signals remain fixed after they are generated.

❓ Can Omega OrderFlow Delta Indicator send trading alerts?

Yes. Omega OrderFlow Delta Indicator supports popup, mobile push, sound, and Telegram alerts for newly confirmed order flow signals.

❓ Which timeframes and markets are suitable for Omega OrderFlow Delta Indicator?

Omega OrderFlow Delta Indicator supports any symbol with suitable data, with M5 to H1 recommended for a balance between order flow detail and market noise.

❓ What is required for Omega OrderFlow Delta Indicator to work correctly?

Omega OrderFlow Delta Indicator works best when the broker provides sufficient tick history. FlowMode can automatically select real trade flags, the tick rule, or an OHLC estimate based on available data.

Other products traders compare

From $25
Instant download
Choose option