Candlestick patterns are one of the most powerful tools in Forex trading. They provide visual insight into market sentiment, helping traders anticipate potential price movements. Whether you’re a beginner or an experienced trader, understanding key candlestick patterns can significantly improve your decision-making process.
In this guide, we’ll explore the top 10 candlestick patterns every Forex trader should know, along with simple explanations and practical insights.
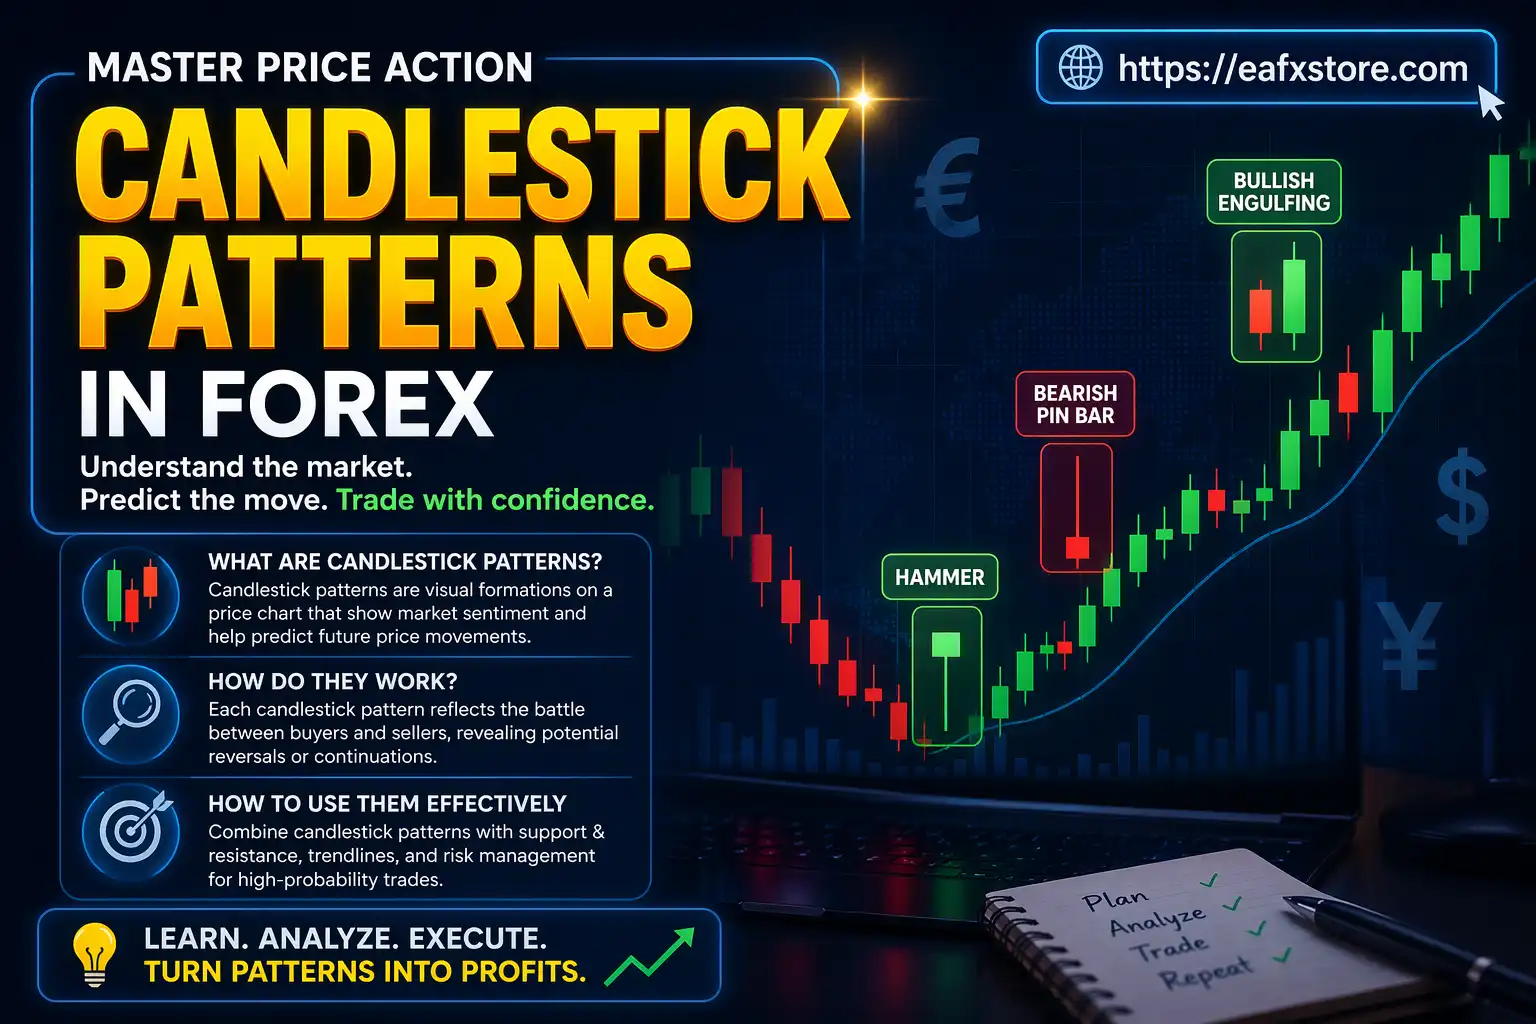
What Are Candlestick Patterns?
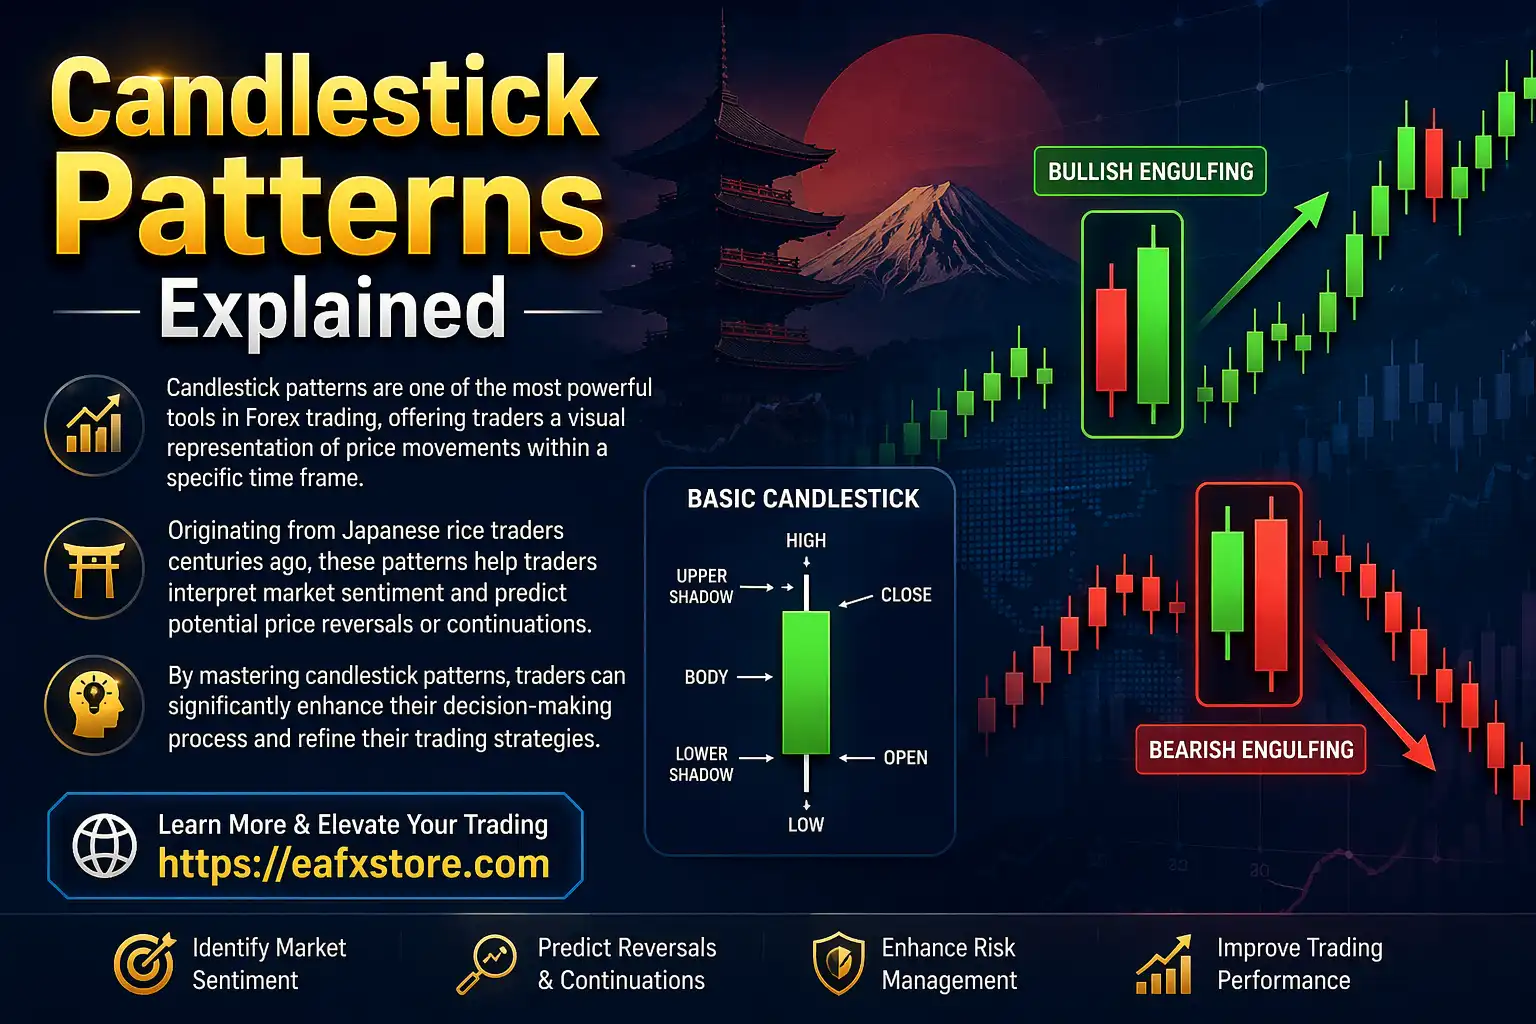
Candlestick patterns are formations created by one or more candlesticks on a price chart. Each candlestick represents price action within a specific timeframe, showing the open, high, low, and close prices.
These patterns help traders identify trends, reversals, and continuations in the market. By recognizing them, traders can better time entries and exits.
Why Candlestick Patterns Matter in Forex Trading
Candlestick patterns reflect the psychology of market participants. They reveal the battle between buyers (bulls) and sellers (bears), making them essential for technical analysis.

Understanding these patterns allows traders to:
- Identify trend reversals early.
- Confirm trade signals.
- Improve risk management.
- Increase overall trading accuracy.
Top 10 Candlestick Patterns Overview
Below is a quick summary of the most important candlestick patterns:
| Pattern Name | Type | Signal Strength | Market Indication |
|---|---|---|---|
| Doji | Neutral | Medium | Indecision |
| Hammer | Bullish | Strong | Reversal (up) |
| Shooting Star | Bearish | Strong | Reversal (down) |
| Engulfing | Both | Strong | Trend reversal |
| Morning Star | Bullish | Strong | Bottom reversal |
| Evening Star | Bearish | Strong | Top reversal |
| Hanging Man | Bearish | Medium | Potential reversal |
| Inverted Hammer | Bullish | Medium | Possible reversal |
| Harami | Both | Medium | Trend weakening |
| Three Soldiers/Crows | Both | Strong | Strong trend signal |
1. Doji Pattern
A Doji forms when the opening and closing prices are nearly equal, creating a small or non-existent body.
This pattern signals indecision in the market. Neither buyers nor sellers are in control, which often precedes a reversal or continuation depending on context.

2. Hammer Pattern
The Hammer appears after a downtrend and has a small body with a long lower wick.
It indicates that sellers pushed prices lower, but buyers regained control before the close. This is a strong bullish reversal signal, especially when confirmed by the next candle.

3. Shooting Star Pattern
The Shooting Star is the opposite of the Hammer and appears after an uptrend.
It has a small body with a long upper wick, signaling that buyers lost momentum and sellers are taking over. This pattern often indicates a bearish reversal.

4. Engulfing Pattern
The Engulfing pattern consists of two candles:
- A smaller candle followed by a larger one that completely engulfs the previous body.
A bullish engulfing pattern signals upward reversal, while a bearish engulfing pattern suggests a downward reversal. It is one of the most reliable candlestick signals.

5. Morning Star Pattern
The Morning Star is a three-candle bullish reversal pattern:
- A strong bearish candle
- A small indecision candle
- A strong bullish candle
This pattern indicates that selling pressure is weakening and buyers are gaining control.

6. Evening Star Pattern
The Evening Star is the bearish counterpart of the Morning Star.
It forms after an uptrend and signals that buying momentum is fading. Traders often use this pattern as an early warning of a potential downtrend.

7. Hanging Man Pattern
The Hanging Man looks similar to the Hammer but appears after an uptrend.
It suggests that selling pressure is increasing, even though the price closed higher. This could signal a potential bearish reversal if confirmed.

8. Inverted Hammer Pattern
The Inverted Hammer appears after a downtrend and has a long upper wick with a small body.
It indicates that buyers attempted to push prices higher. While not as strong as the Hammer, it still suggests a possible bullish reversal.

9. Harami Pattern
The Harami is a two-candle pattern where a small candle is contained within the previous larger candle.
It indicates that the current trend is losing momentum. A bullish Harami appears in a downtrend, while a bearish Harami appears in an uptrend.

10. Three White Soldiers and Three Black Crows
These are strong multi-candle patterns:
- Three White Soldiers: Three consecutive bullish candles signaling a strong uptrend
- Three Black Crows: Three consecutive bearish candles indicating a strong downtrend
These patterns show sustained momentum and are highly reliable when confirmed with volume or indicators.

How to Use Candlestick Patterns Effectively
While candlestick patterns are powerful, they should not be used in isolation. For best results:
- Combine them with Support and resistance levels
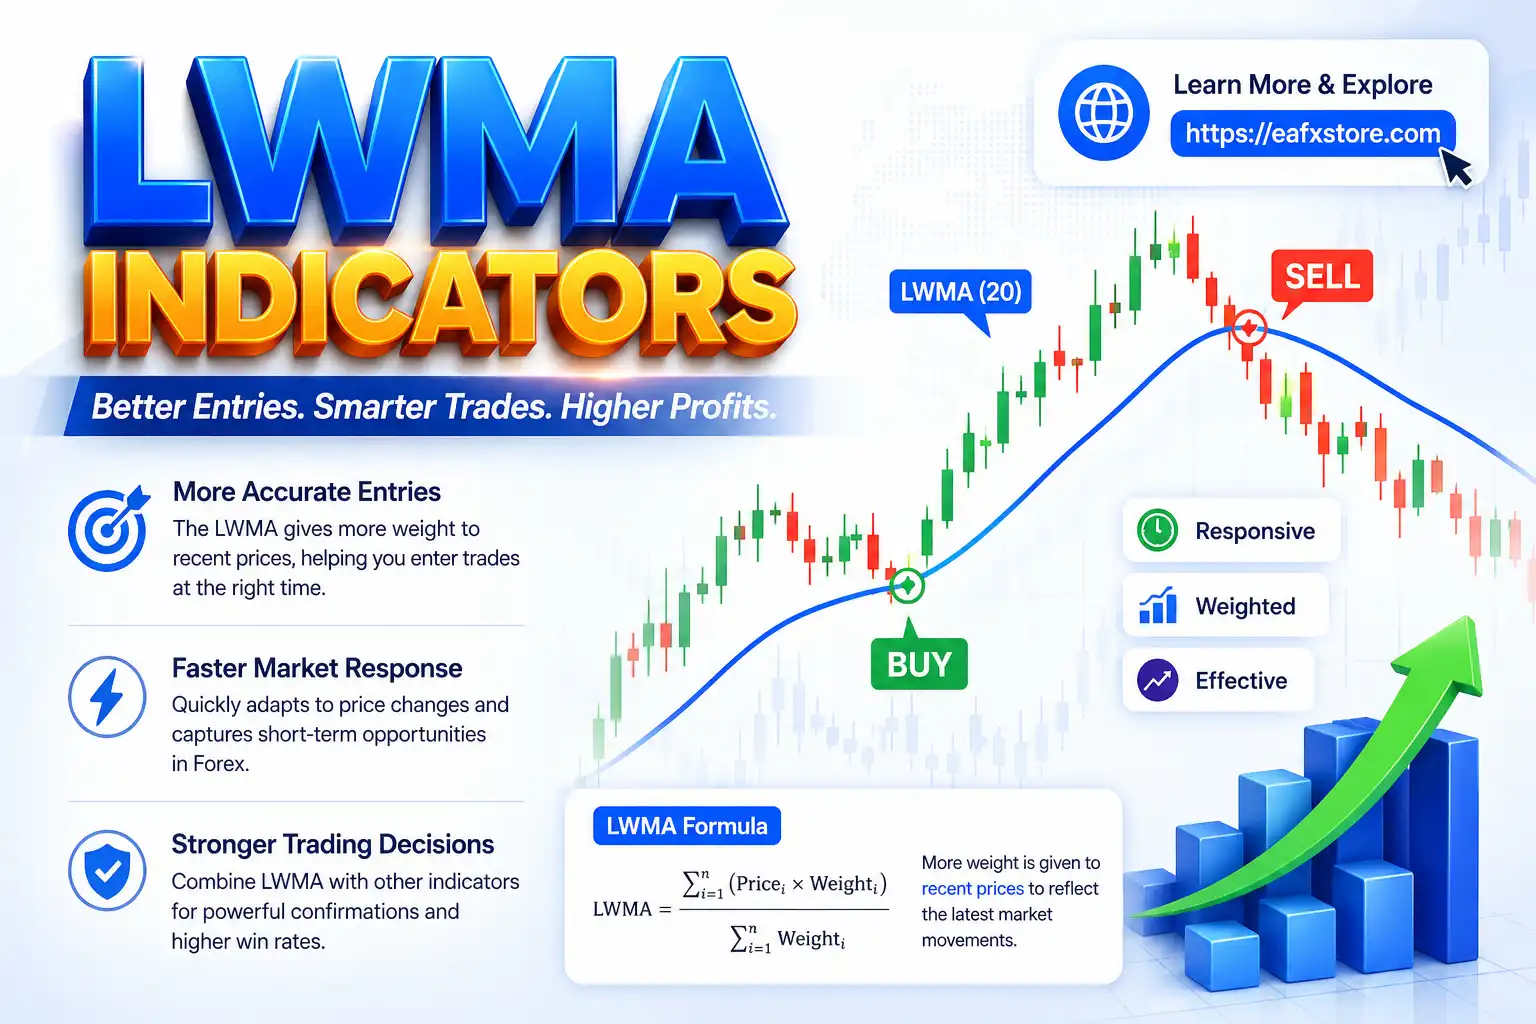
- Use technical indicators like RSI or Moving Averages
- Always wait for confirmation before entering trades
- Apply proper risk management strategies
Context is key. The same pattern can have different meanings depending on the market environment.
Common Mistakes to Avoid
Many traders misuse candlestick patterns due to lack of context or overconfidence. Here are some common pitfalls:
- Trading patterns without confirmation.
- Ignoring the overall trend.
- Overtrading based on weak signals.
- Not using stop-loss orders.
Avoiding these mistakes can significantly improve your trading performance.
Final Thoughts
Candlestick patterns are an essential part of Forex trading. By mastering these top 10 patterns, you can gain a deeper understanding of market behavior and improve your trading decisions.
However, success doesn’t come from memorizing patterns alone. It comes from practice, discipline, and combining multiple tools into a well-structured strategy.