Introduction to Candlestick Patterns
Candlestick patterns are one of the most powerful tools in Forex trading, offering traders a visual representation of price movements within a specific time frame. Originating from Japanese rice traders centuries ago, these patterns help traders interpret market sentiment and predict potential price reversals or continuations. By mastering candlestick patterns, traders can significantly enhance their decision-making process and refine their trading strategies.
Why Candlestick Patterns Matter in Forex
Candlestick patterns are essential because they provide immediate insights into market psychology. Each candle reflects the battle between buyers and sellers, showing who is in control. Unlike simple line charts, candlesticks reveal opening, closing, high, and low prices, giving traders a fuller picture.

Understanding these patterns allows traders to:
- Identify trend reversals early.
- Confirm entry and exit points.
- Improve risk management.
- Combine with technical indicators for stronger signals.
In the highly volatile Forex market, timing is everything—and candlestick patterns can give traders a crucial edge.
Basic Structure of a Candlestick
Before diving into patterns, it’s important to understand how a candlestick is formed. Each candlestick consists of two main parts:
- Body: Represents the opening and closing prices.
- Wicks (Shadows): Show the highest and lowest prices during the time period.
If the closing price is higher than the opening price, the candle is typically bullish. If the closing price is lower, it is bearish. The length of the body and wicks provides clues about market strength and volatility.
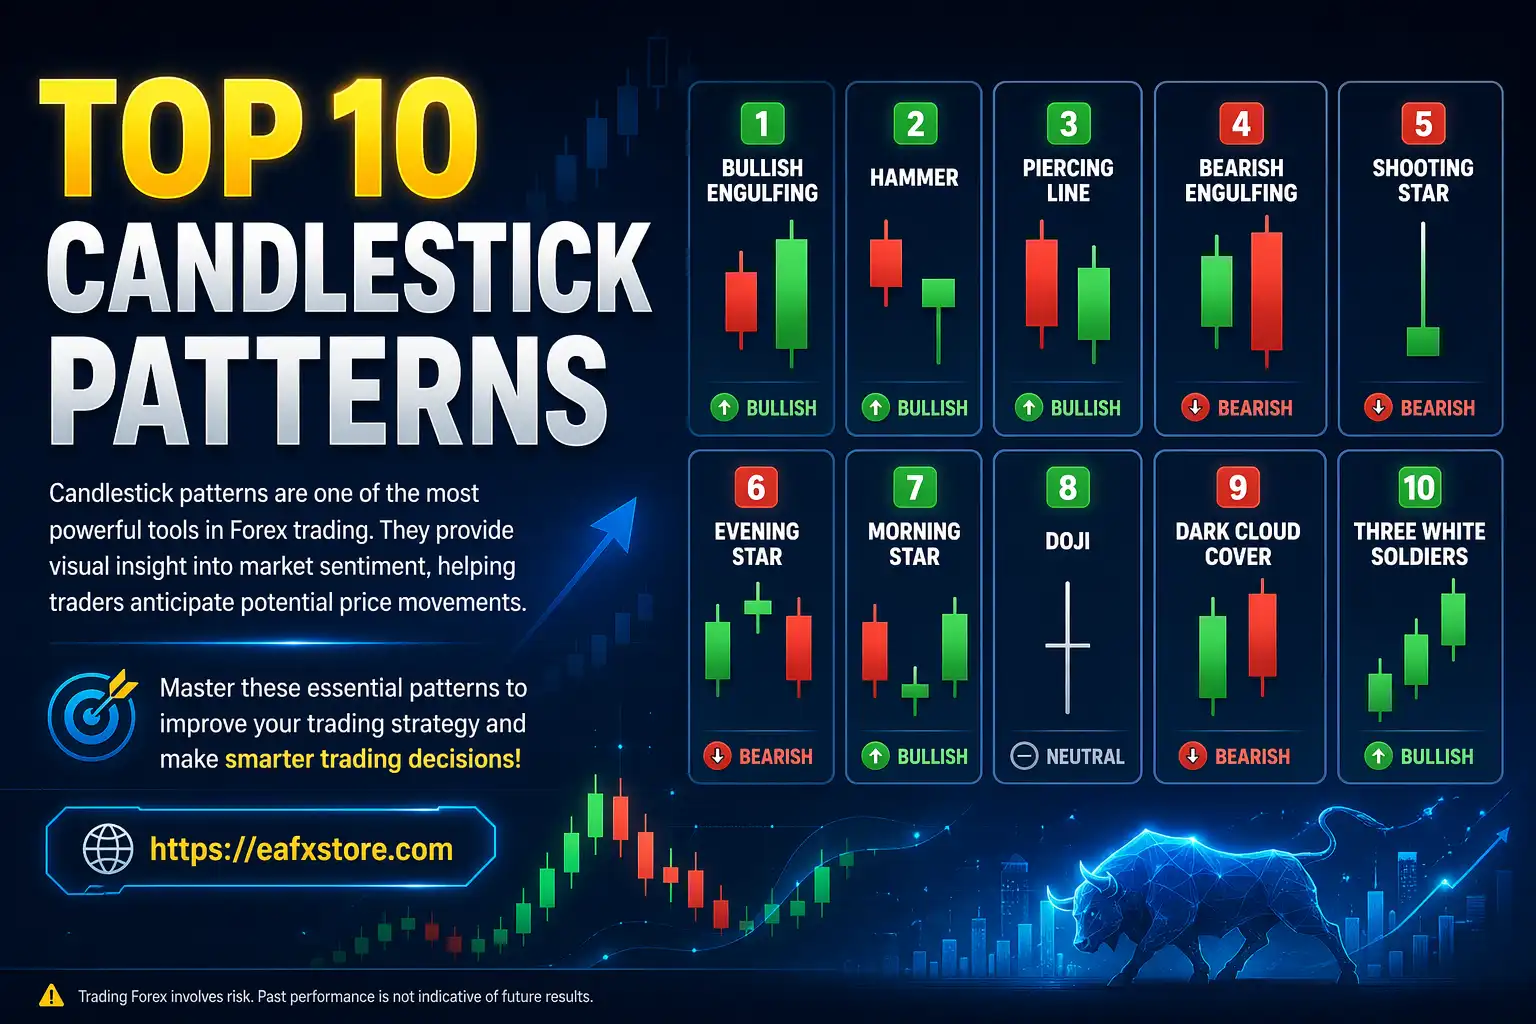
Common Bullish Candlestick Patterns
Bullish patterns signal potential upward price movement. These are especially useful when identified at support levels or after a downtrend.

1. Hammer Patterns
The Hammer has a small body and a long lower wick. It indicates that sellers pushed prices down, but buyers regained control before the close. This suggests a potential reversal to the upside.
2. Bullish Engulfing Patterns
This pattern occurs when a large bullish candle completely engulfs the previous bearish candle. It signals strong buying pressure and often marks the beginning of an uptrend.
3. Morning Star Patterns
A three-candle pattern consisting of a bearish candle, a small indecisive candle, and a strong bullish candle. It indicates a shift from selling pressure to buying momentum.
These patterns are most effective when combined with volume analysis or support levels.
Common Bearish Candlestick Patterns
Bearish patterns indicate potential downward price movement and are useful for identifying selling opportunities.

1. Shooting Star Patterns
This pattern has a small body and a long upper wick. It shows that buyers attempted to push prices higher, but sellers took control, suggesting a possible reversal downward.
2. Bearish Engulfing Patterns
A large bearish candle engulfs the previous bullish candle. This indicates strong selling pressure and a potential trend reversal.
3. Evening Star Patterns
The opposite of the Morning Star, this three-candle pattern signals a shift from bullish to bearish sentiment.
Recognizing these patterns can help traders exit long positions or enter short trades at optimal points.
Key Candlestick Patterns Comparison Table
| Pattern Name | Type | Signal Strength | Market Indication |
|---|---|---|---|
| Hammer | Bullish | Medium | Reversal upward |
| Bullish Engulfing | Bullish | Strong | Strong buying pressure |
| Morning Star | Bullish | Strong | Trend reversal |
| Shooting Star | Bearish | Medium | Reversal downward |
| Bearish Engulfing | Bearish | Strong | Strong selling pressure |
| Evening Star | Bearish | Strong | Trend reversal |
This table provides a quick reference for traders to identify and interpret patterns efficiently.
How to Use Candlestick Patterns in Trading Strategy
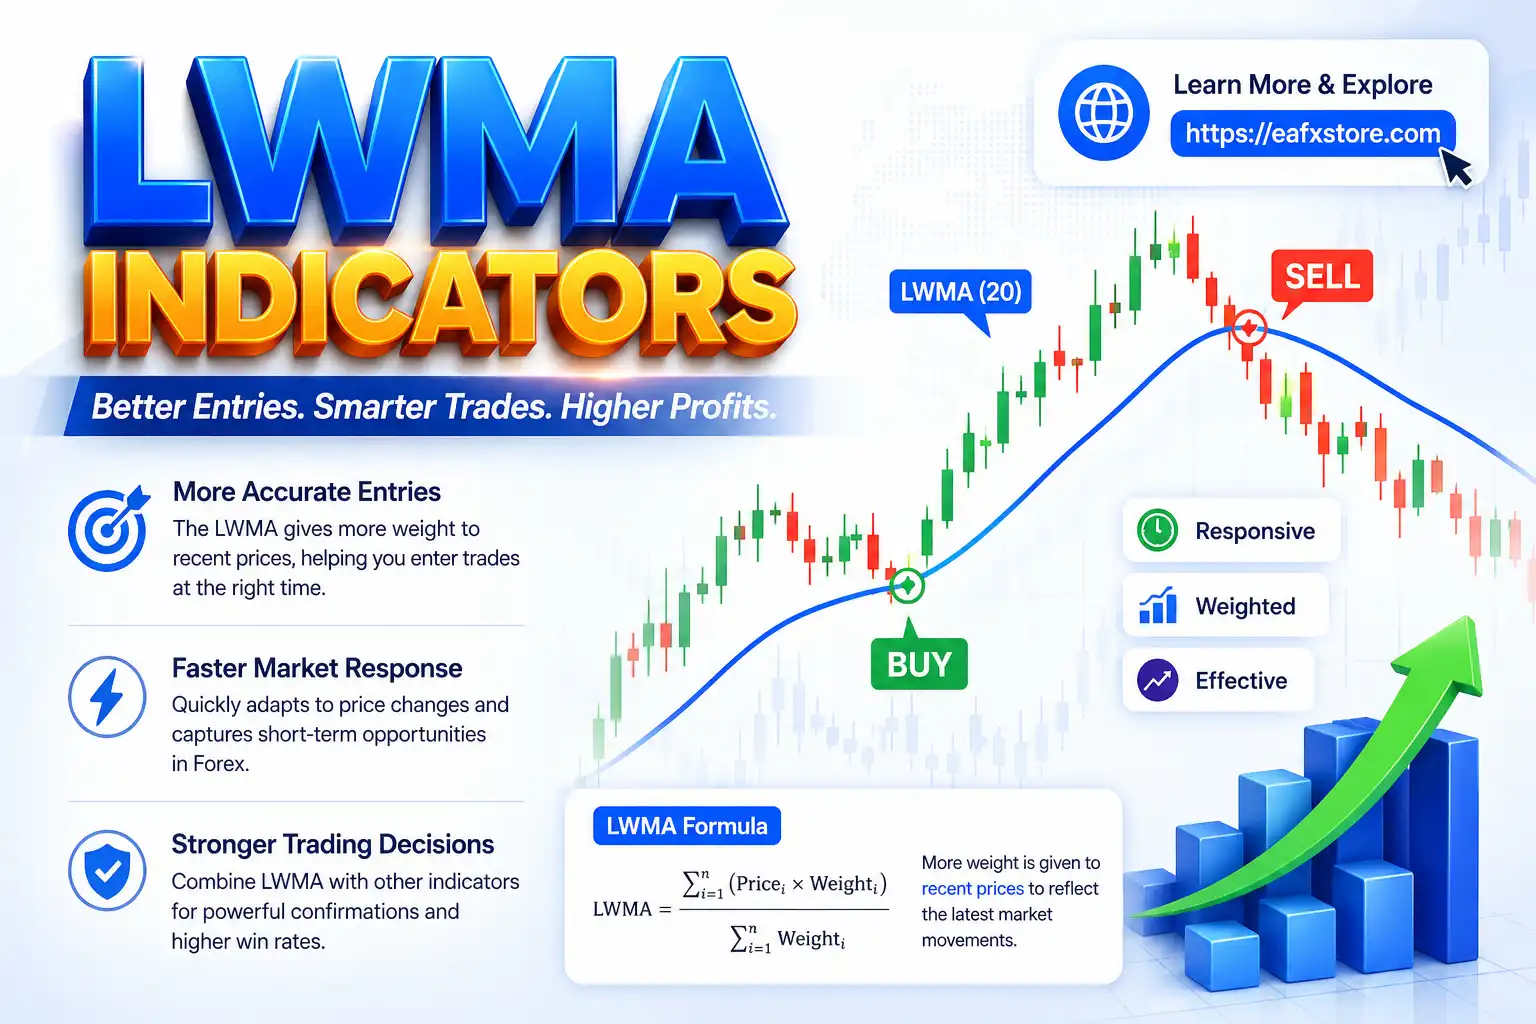
Candlestick patterns should not be used in isolation. To maximize their effectiveness, traders should combine them with other technical tools such as support and resistance levels, moving averages, and indicators like RSI or MACD.
Here are some practical tips:
- Confirm the trend: Use higher time frames to validate signals.
- Wait for confirmation: Avoid entering trades prematurely.
- Use stop-loss orders: Protect your capital from unexpected market moves.
- Combine indicators: Strengthen your analysis with multiple signals.
A disciplined approach ensures that candlestick patterns become a reliable part of your trading system rather than random signals.

Common Mistakes Traders Should Avoid
Many beginners misuse candlestick patterns, leading to poor trading decisions. One common mistake is over-relying on a single pattern without confirmation. Another is ignoring the broader market context, such as trends or economic news.
Additionally, traders often:
- Misinterpret patterns in low-volume markets.
- Enter trades too early.
- Ignore risk management principles.
Avoiding these mistakes can significantly improve trading performance and consistency.
Conclusion
Candlestick patterns are a fundamental component of Forex trading, offering valuable insights into market behavior and potential price movements. By understanding both bullish and bearish patterns, traders can make more informed decisions and enhance their overall strategy.
However, success in Forex trading requires more than just pattern recognition. Combining candlestick analysis with proper risk management, technical indicators and market awareness is key to long-term profitability. Master these patterns, practice consistently, and you’ll be well on your way to boosting your Forex trading strategy.