Introduction to the Stochastic Indicator
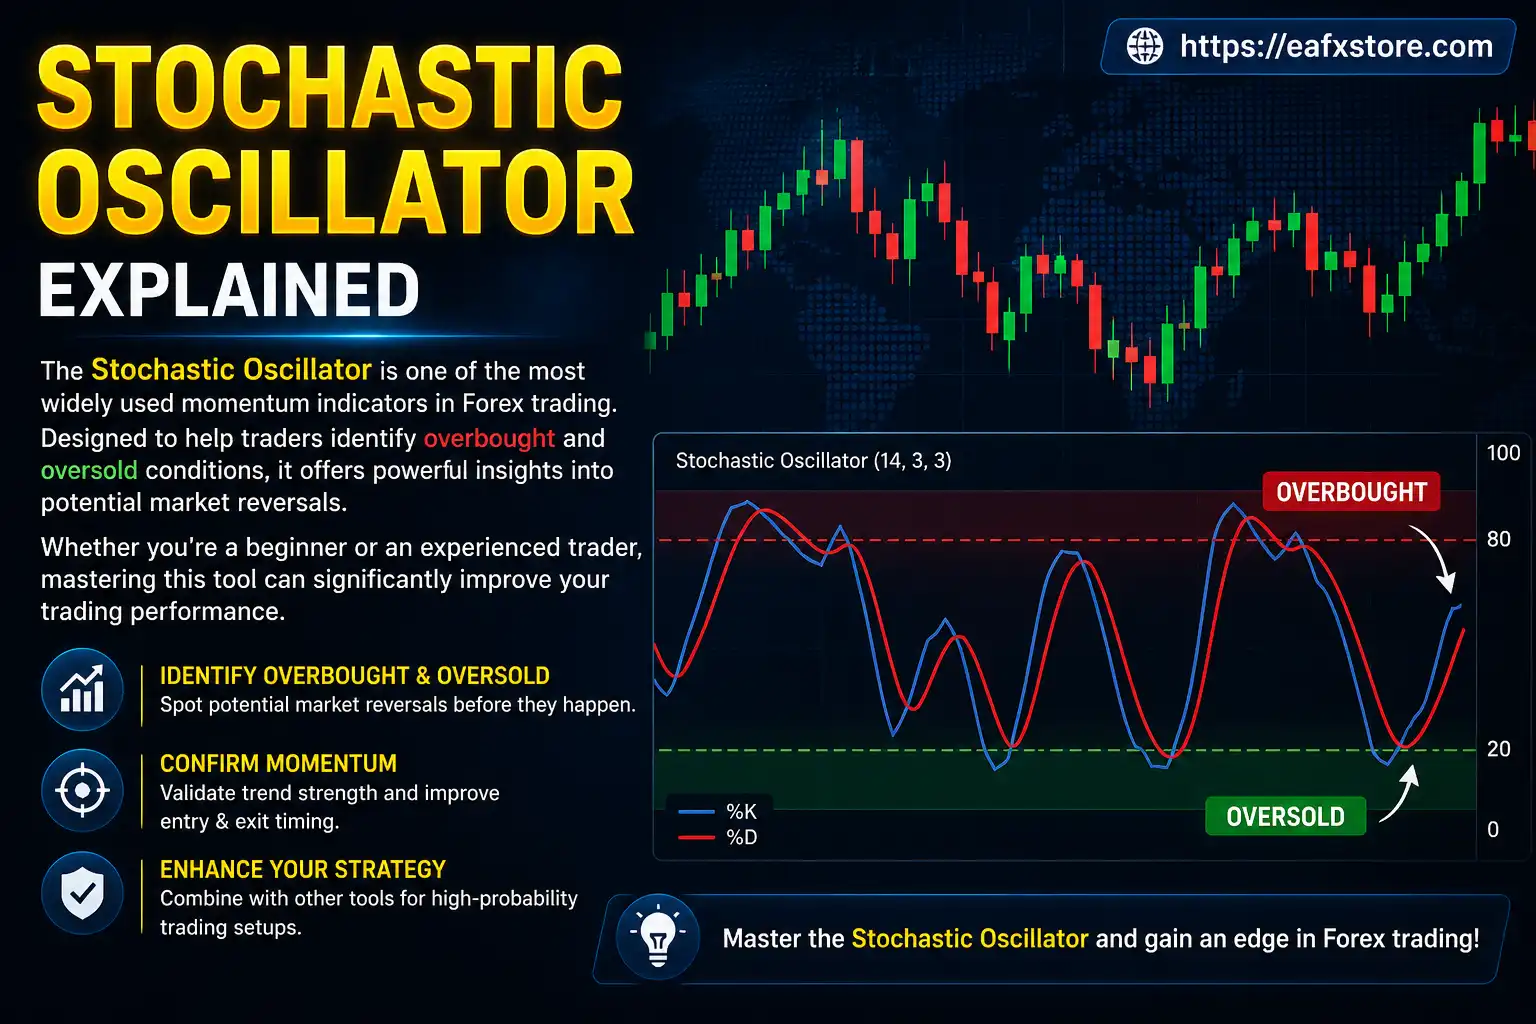
The stochastic indicator is one of the most popular tools in Forex trading, especially among beginners who want a simple yet effective way to analyze market momentum. Developed by George Lane in the late 1950s, this indicator helps traders identify overbought and oversold conditions in the market.
At its core, the stochastic indicator compares a currency pair’s closing price to its price range over a specific period. Instead of focusing solely on price direction, it highlights the strength and speed of price movements. This makes it particularly useful in spotting potential reversals before they happen.
How the Stochastic Indicator Works
The stochastic indicator consists of two lines: %K and %D. The %K line is the main line, while %D is a moving average of %K, acting as a signal line. These lines fluctuate between 0 and 100.
When the indicator moves toward the upper boundary (above 80), it suggests that the market may be overbought. When it drops below 20, it indicates oversold conditions. However, these signals should not be taken blindly—they work best when combined with other analysis methods.
The key idea behind the stochastic indicator is that in an uptrend, prices tend to close near their highs, and in a downtrend, they close near their lows. By tracking this behavior, traders can anticipate shifts in momentum.

Key Components of the Stochastic Indicator
| Component | Description |
|---|---|
| %K Line | The primary line that reflects the current price relative to the range |
| %D Line | A smoothed moving average of %K used for signals |
| Overbought Level | Typically above 80, indicating potential downward reversal |
| Oversold Level | Typically below 20, indicating potential upward reversal |
| Period Setting | Commonly set to 14 periods for balanced sensitivity |
Each component plays a role in helping traders interpret market conditions. Beginners should start with default settings before experimenting with adjustments.
How to Use the Stochastic Indicator in Forex Trading
Identifying Overbought and Oversold Conditions
One of the simplest ways to use the stochastic indicator is to identify overbought and oversold levels. When the indicator rises above 80, it suggests that the asset might be overbought and due for a correction. Conversely, when it falls below 20, it indicates oversold conditions and a possible upward reversal.
However, strong trends can keep the indicator in these zones for extended periods. This is why relying solely on these levels can lead to premature trades.
Spotting Crossovers
Crossovers between the %K and %D lines provide trading signals. When the %K line crosses above the %D line, it generates a bullish signal. When it crosses below, it signals bearish momentum.
These crossovers are more reliable when they occur in overbought or oversold regions, as they suggest a higher probability of trend reversal.
Divergence Trading
Divergence occurs when the price moves in one direction while the stochastic indicator moves in another. For example, if price makes higher highs but the indicator forms lower highs, it may signal weakening momentum.
This technique is more advanced but highly valuable. It helps traders anticipate reversals before they are visible on the price chart.

Advantages of the Stochastic Indicator
The stochastic indicator offers several benefits that make it appealing for beginners:
- Easy to Understand: Its clear scale (0–100) simplifies interpretation.
- Early Signals: Helps identify potential reversals before they occur.
- Versatility: Works across different timeframes and currency pairs.
- Momentum Insight: Provides a deeper view beyond price action.
Because of these advantages, many traders include it as part of their core technical analysis toolkit.
Limitations You Should Be Aware Of
Despite its usefulness, the stochastic indicator is not perfect. Beginners should be cautious about its limitations:
- False Signals in Strong Trends: The indicator may stay overbought or oversold for long periods.
- Lagging Nature: Signals may come slightly after price movement.
- Requires Confirmation: Works best when combined with other indicators or price action.
Understanding these limitations helps traders avoid common mistakes and improve decision-making.
Best Settings for Beginners
For most beginners, the default setting of (14, 3, 3) is recommended. This configuration balances sensitivity and reliability, making it suitable for various trading styles.
- 14 periods: Measures the price range.
- 3-period smoothing: Reduces noise in %K.
- 3-period signal line: Creates the %D line.
As you gain experience, you can adjust these settings depending on your strategy. Shorter periods make the indicator more responsive but also more prone to false signals.
Combining Stochastic with Other Indicators
The stochastic indicator becomes significantly more powerful when used alongside other tools. Combining indicators helps filter out false signals and improves accuracy.
Some effective combinations include:
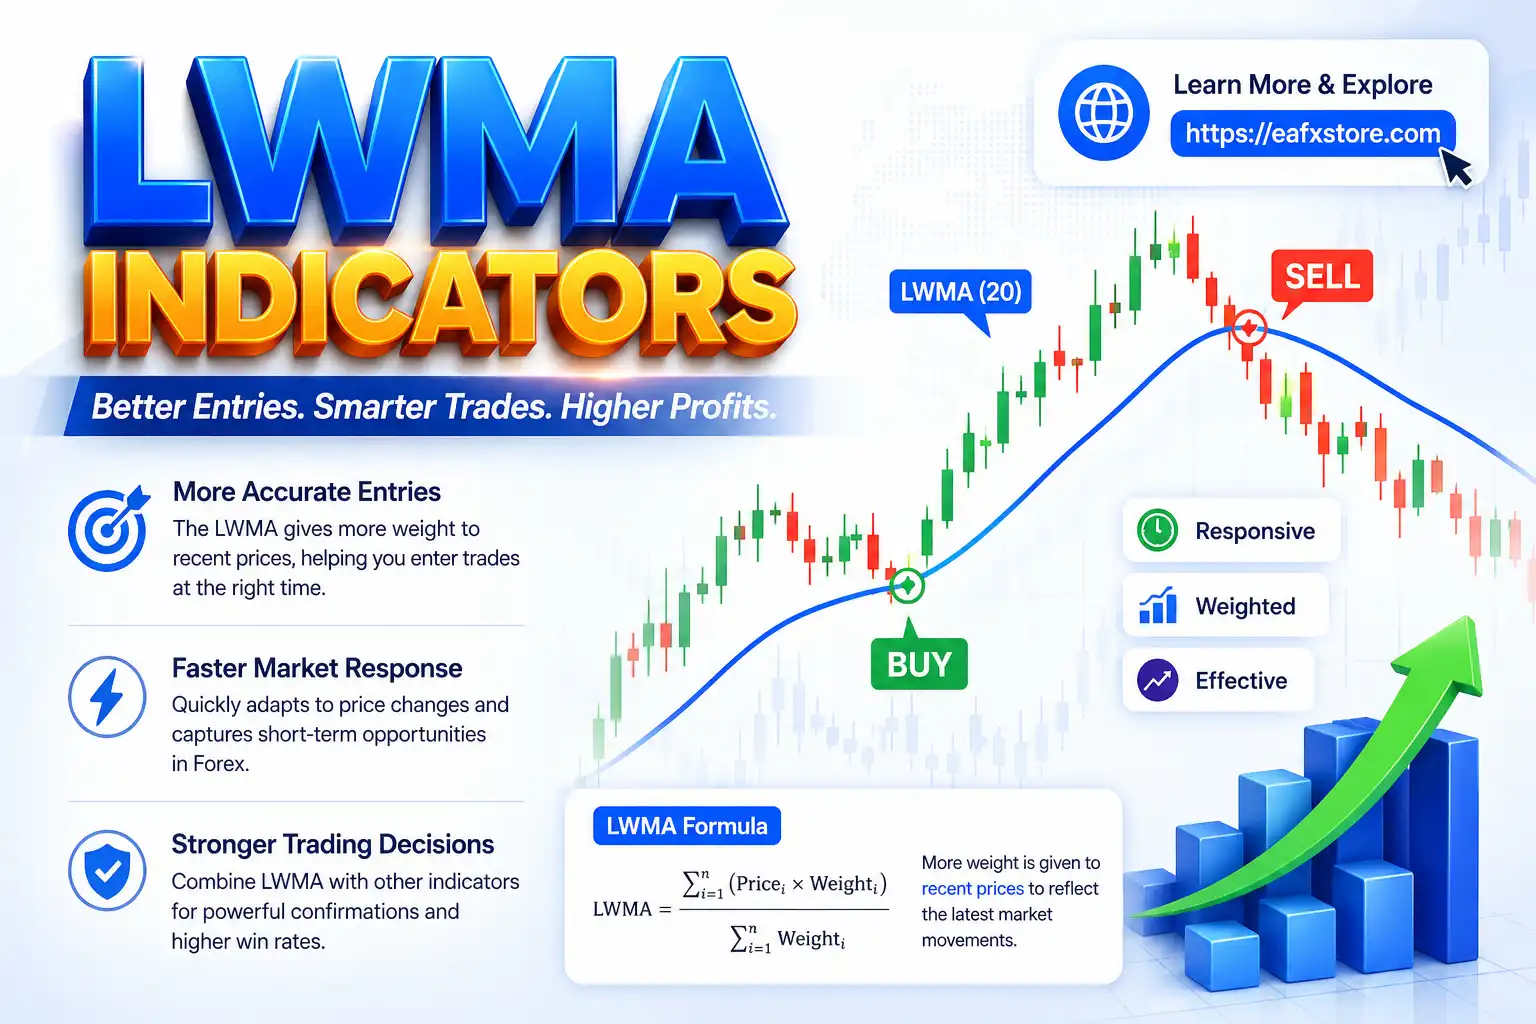
- Moving Averages: Confirm trend direction before taking signals.
- Support and Resistance Levels: Validate entry and exit points.
- RSI (Relative Strength Index): Double-check overbought/oversold conditions.
- Trendlines: Identify the overall market structure.
For example, if the stochastic indicator shows an oversold condition and price is at a strong support level, the probability of a successful trade increases.
Practical Example of Stochastic Indicator Strategy
A simple beginner strategy involves the following steps:
- Identify the trend using a moving average.
- Wait for the stochastic indicator to enter the oversold or overbought zone.
- Look for a crossover signal (%K crossing %D).
- Confirm with price action or support/resistance.
- Enter the trade with proper risk management.
This structured approach helps beginners avoid impulsive decisions and trade with more confidence.
Risk Management When Using Stochastic
No trading strategy is complete without proper risk management. Even the best indicator cannot guarantee success.
Always consider the following:
- Use Stop Loss (SL) orders to limit potential losses.
- Avoid risking more than 1–2% of your trading capital per trade.
- Do not rely solely on one indicator.
- Stay disciplined and avoid emotional trading.
By combining the stochastic indicator with strong risk management, you create a more sustainable trading approach.
Conclusion
The stochastic indicator is a powerful yet beginner-friendly tool in Forex trading. It helps traders understand market momentum, identify overbought and oversold conditions and anticipate potential reversals.
While it is easy to use, it should not be relied upon in isolation. Combining it with other technical tools and applying proper risk management significantly improves its effectiveness.
For beginners, mastering the stochastic indicator is a great step toward building a solid foundation in Forex trading. With practice and discipline, it can become a valuable part of your trading strategy.