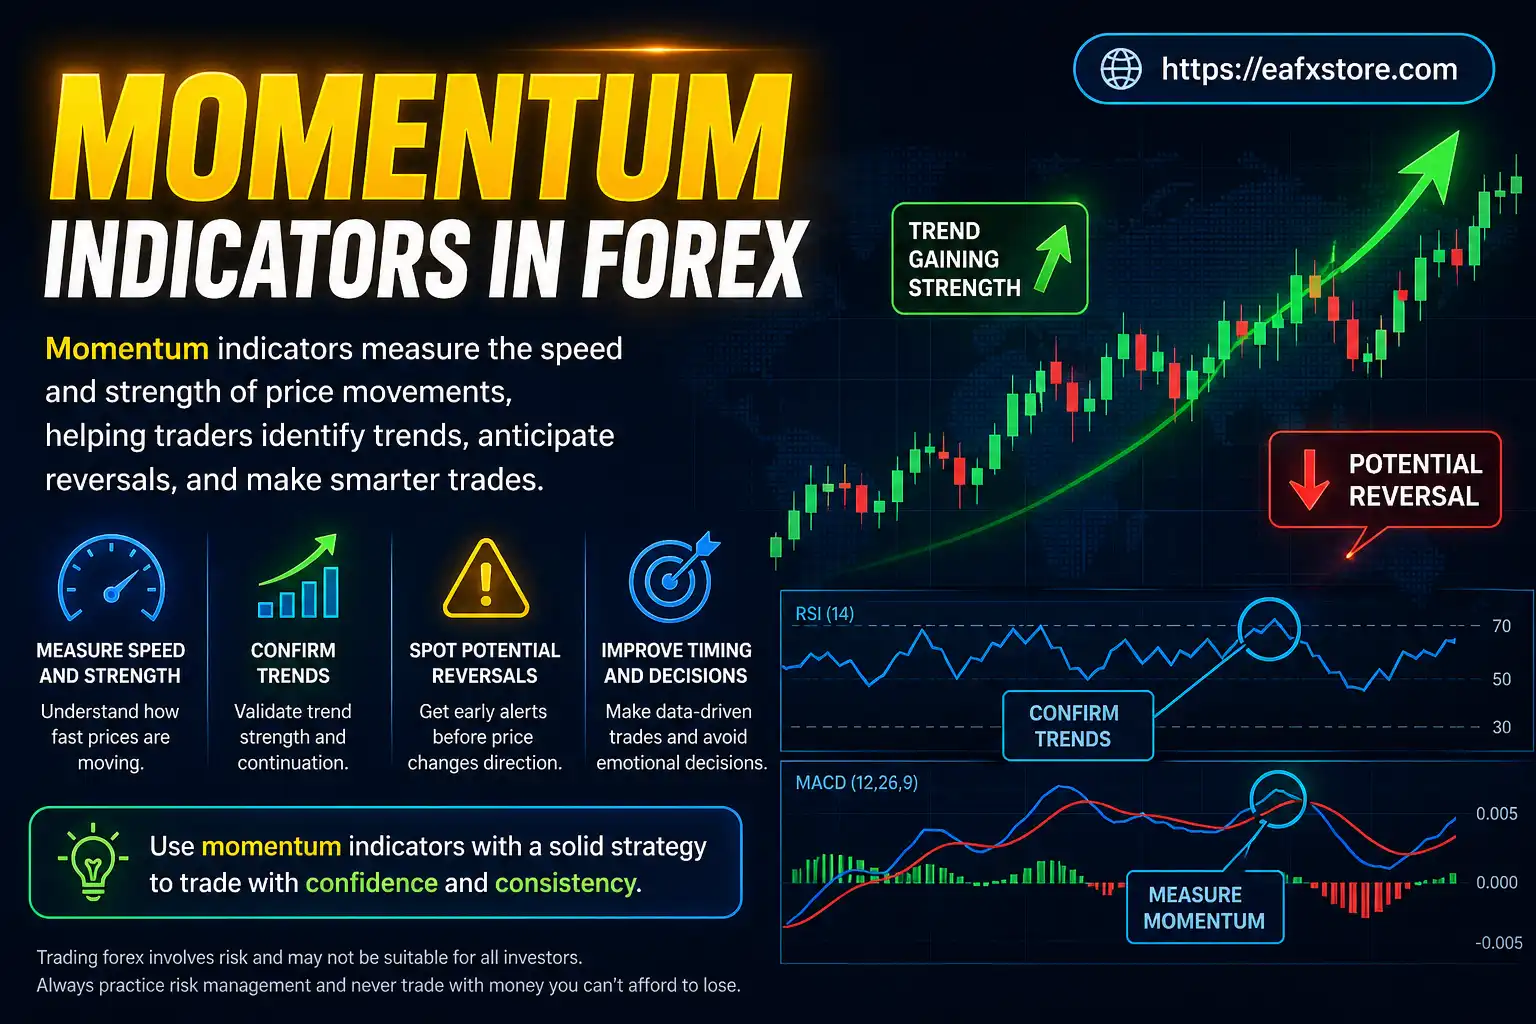
Momentum indicators are essential tools in Forex trading, helping traders identify the strength and speed of price movements. Whether you are a beginner or an experienced trader, understanding how momentum works can significantly improve your entry and exit decisions.
In this guide, we’ll explore the most important momentum indicators every Forex trader should know, how they work, and how to use them effectively.
What are Momentum Indicators?
Momentum indicators are technical analysis tools that measure the rate at which price changes over a given period. Instead of simply tracking price direction, they help traders understand how strong a trend is.
These indicators are especially useful for:
- Identifying overbought and oversold conditions.
- Spotting trend reversals.
- Confirming existing trends.
- Improving timing for entries and exits.
In Forex trading, where price movements can be fast and volatile, momentum indicators provide valuable insights into market behavior.
Relative Strength Index (RSI)
The Relative Strength Index (RSI) is one of the most popular momentum indicators. It measures the speed and change of price movements on a scale from 0 to 100.
Typically:
- RSI above 70 indicates overbought conditions
- RSI below 30 indicates oversold conditions
Traders often use RSI to anticipate potential reversals. For example, when RSI moves above 70, it may signal that the currency pair is overvalued and could soon decline.
RSI also works well with divergence strategies. If price is making higher highs while RSI is making lower highs, it may indicate weakening momentum and a possible reversal.

Moving Average Convergence Divergence (MACD)
MACD is a trend-following momentum indicator that shows the relationship between two moving averages.
It consists of:
- MACD line
- Signal line
- Histogram
The key signals include:
- Bullish crossover: MACD line crosses above the signal line
- Bearish crossover: MACD line crosses below the signal line
MACD is highly effective in identifying trend direction and momentum shifts. Traders often combine it with other indicators to confirm signals and reduce false entries.

Stochastic Oscillator
The Stochastic Oscillator compares a currency pair’s closing price to its price range over a specific period.
It operates between 0 and 100:
- Above 80: Overbought
- Below 20: Oversold
This indicator is particularly useful in ranging markets. It helps traders identify turning points when the market lacks a clear trend.
Additionally, stochastic crossovers can signal potential buy or sell opportunities. When the %K line crosses above the %D line, it may indicate a bullish signal and vice versa.

Commodity Channel Index (CCI)
The Commodity Channel Index (CCI) measures the deviation of price from its statistical average.
Unlike RSI or Stochastic, CCI does not have fixed boundaries. However:
- Above +100: Strong upward momentum
- Below -100: Strong downward momentum
CCI is useful for identifying new trends. When the indicator moves beyond these thresholds, it may signal the beginning of a strong trend.
Forex traders often use CCI to spot breakout opportunities and confirm trend strength.

Momentum Indicator
The Momentum Indicator is a straightforward tool that compares the current price to a previous price over a set period.
It oscillates around a baseline (usually 100 or 0 depending on the platform):
- Above baseline: Bullish momentum
- Below baseline: Bearish momentum
This indicator is simple but powerful. It helps traders quickly assess whether the market is gaining or losing strength.
Because of its simplicity, it is often used alongside other indicators for confirmation rather than as a standalone tool.

Average Directional Index (ADX)
The Average Directional Index (ADX) measures the strength of a trend, not its direction.
ADX values:
- Below 20: Weak or no trend
- Above 25: Strong trend
ADX is often used with the +DI and -DI lines:
- +DI above -DI: Bullish trend
- -DI above +DI: Bearish trend
This indicator is especially useful for determining whether to use trend-following strategies or range-based strategies.

Williams %R
Williams %R is a momentum indicator similar to the Stochastic Oscillator. It measures overbought and oversold levels but uses a reversed scale.
Values range from 0 to -100:
- Between -20 and 0: Overbought
- Between -80 and -100: Oversold
This indicator reacts quickly to price changes, making it useful for short-term trading strategies. However, due to its sensitivity, it can also produce false signals, so confirmation is important.

Comparison Table of Key Momentum Indicators
| Indicator | Best Use Case | Strength | Limitation |
|---|---|---|---|
| RSI | Overbought/Oversold | Easy to use | Can give false signals in strong trends |
| MACD | Trend & Momentum | Reliable crossovers | Slight lag |
| Stochastic | Ranging markets | Precise entry signals | Less effective in trends |
| CCI | Trend detection | Identifies breakouts | No fixed range |
| Momentum | Strength measurement | Simple and clear | Needs confirmation |
| ADX | Trend strength | Filters strategies | Doesn’t show direction |
| Williams %R | Short-term trading | Fast signals | High sensitivity |
How to Combine Momentum Indicators
Using a single indicator can be risky, as no tool is 100% accurate. Many professional Forex traders combine multiple momentum indicators to improve reliability.
For example:
- Use RSI to identify overbought conditions.
- Confirm with MACD crossover.
- Validate trend strength with ADX.
This layered approach helps reduce false signals and improves overall trading accuracy.
However, avoid using too many indicators at once. Overloading your chart can lead to confusion and conflicting signals.
Common Mistakes to Avoid
Many traders misuse momentum indicators, which can lead to losses. Here are some common mistakes:
- Relying on one indicator only: Always confirm signals with other tools.
- Ignoring market context: Indicators behave differently in trending vs ranging markets.
- Overtrading signals: Not every signal is worth taking.
- Using default settings blindly: Customize indicators to suit your trading style.
Understanding the limitations of each indicator is just as important as knowing how to use them.
Final Thoughts
Momentum indicators are powerful tools that can enhance your Forex trading strategy. They provide insights into market strength, help identify reversals and improve timing.
However, success doesn’t come from using indicators alone. It requires discipline, risk management and a well-tested trading plan.
Start by mastering a few key indicators like RSI, MACD and ADX. As you gain experience, you can expand your toolkit and refine your strategy.