

🔢 Omega Fib Confluence - Inputs Setup Guide
🔢 Before You Start
⚙️ Requirements
🔹 MetaTrader 5 on Windows (the licence and Telegram functions use the Windows internet library).
🔹 A valid licence key from eafxstore.com.
🔹 An internet connection for the licence check (the indicator keeps working for up to 72 hours offline after a successful check).
🔹 “Allow DLL imports” enabled — without it the licence check stops the indicator.
⚙️ Installation
🔹 In MetaTrader 5 open File → Open Data Folder.
🔹 Open MQL5 → Indicators and copy the indicator file (OmegaFibConfluence_v1.0.ex5) into it.
🔹 Return to MetaTrader 5, right-click Indicators in the Navigator window and choose Refresh (or restart the terminal).
🔹 Open Tools → Options → Expert Advisors and tick Allow DLL imports.
🔹 Drag 0 from the Navigator onto a chart.
🔹 In the Common tab make sure Allow DLL imports is ticked for this indicator.
🔹 In the Inputs tab enter your licence key in Licence key from eafxstore.com, adjust any other settings, then click OK.
🔹 Check the Experts tab at the bottom of the terminal: you should see “Licence: Licence OK”. If there is a problem, the reason is printed there and shown in the top-left corner of the chart.
⚙️ How the Inputs tab is organised
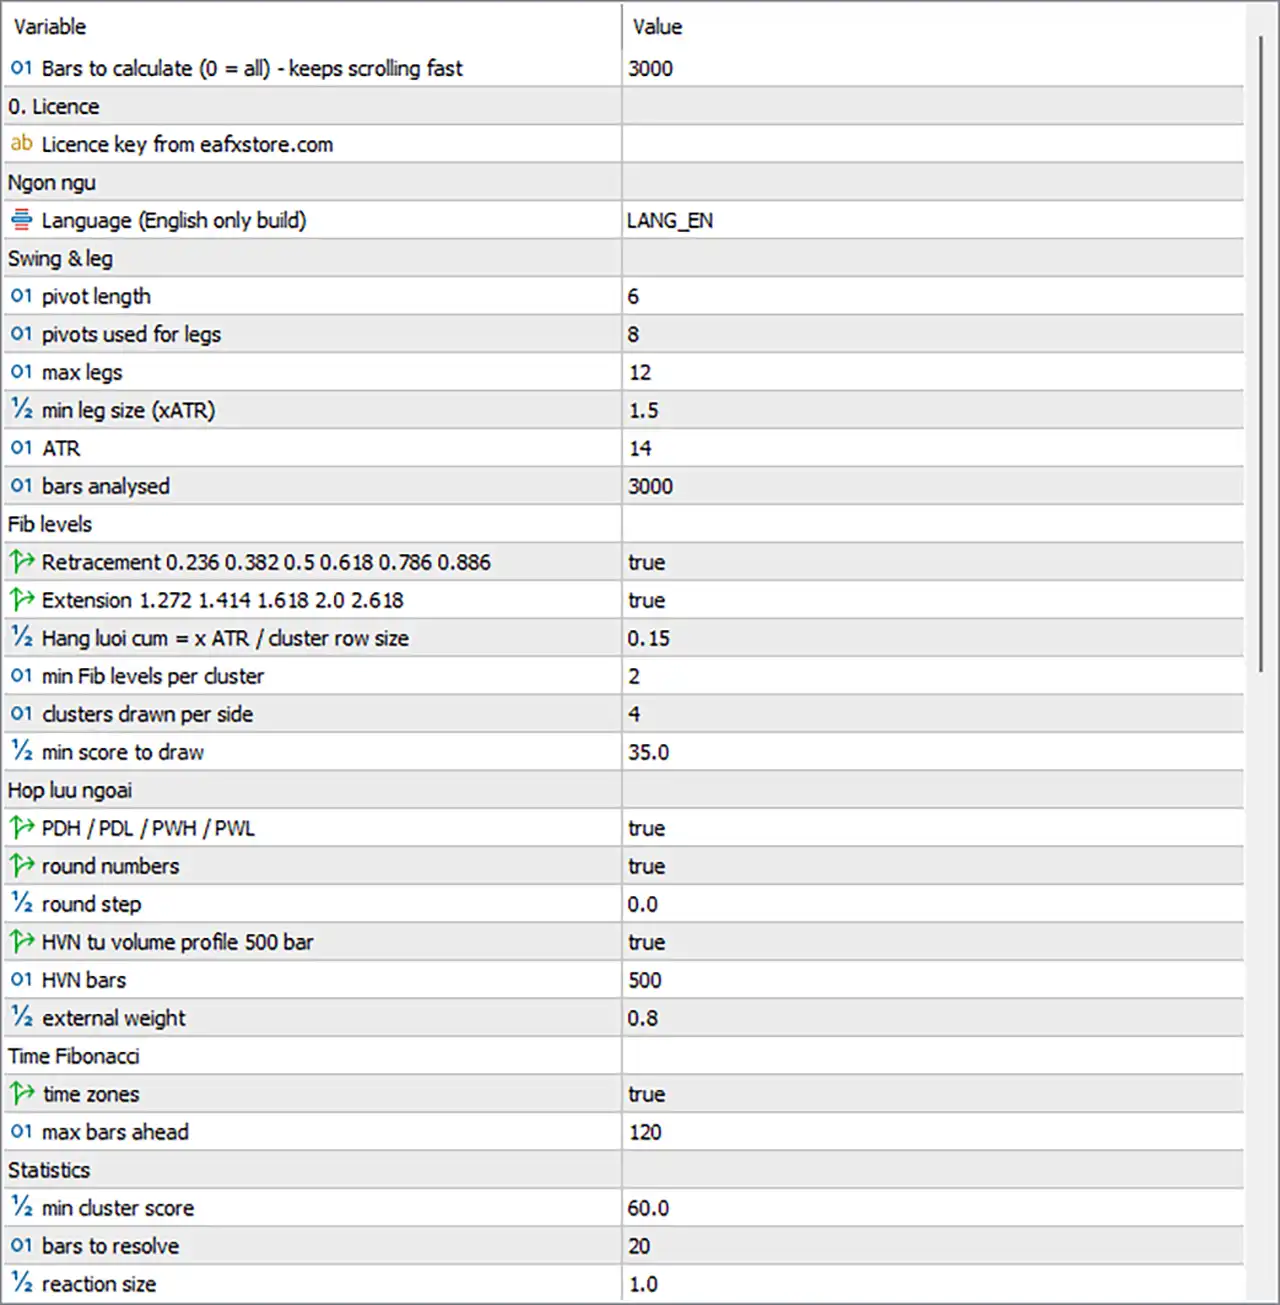
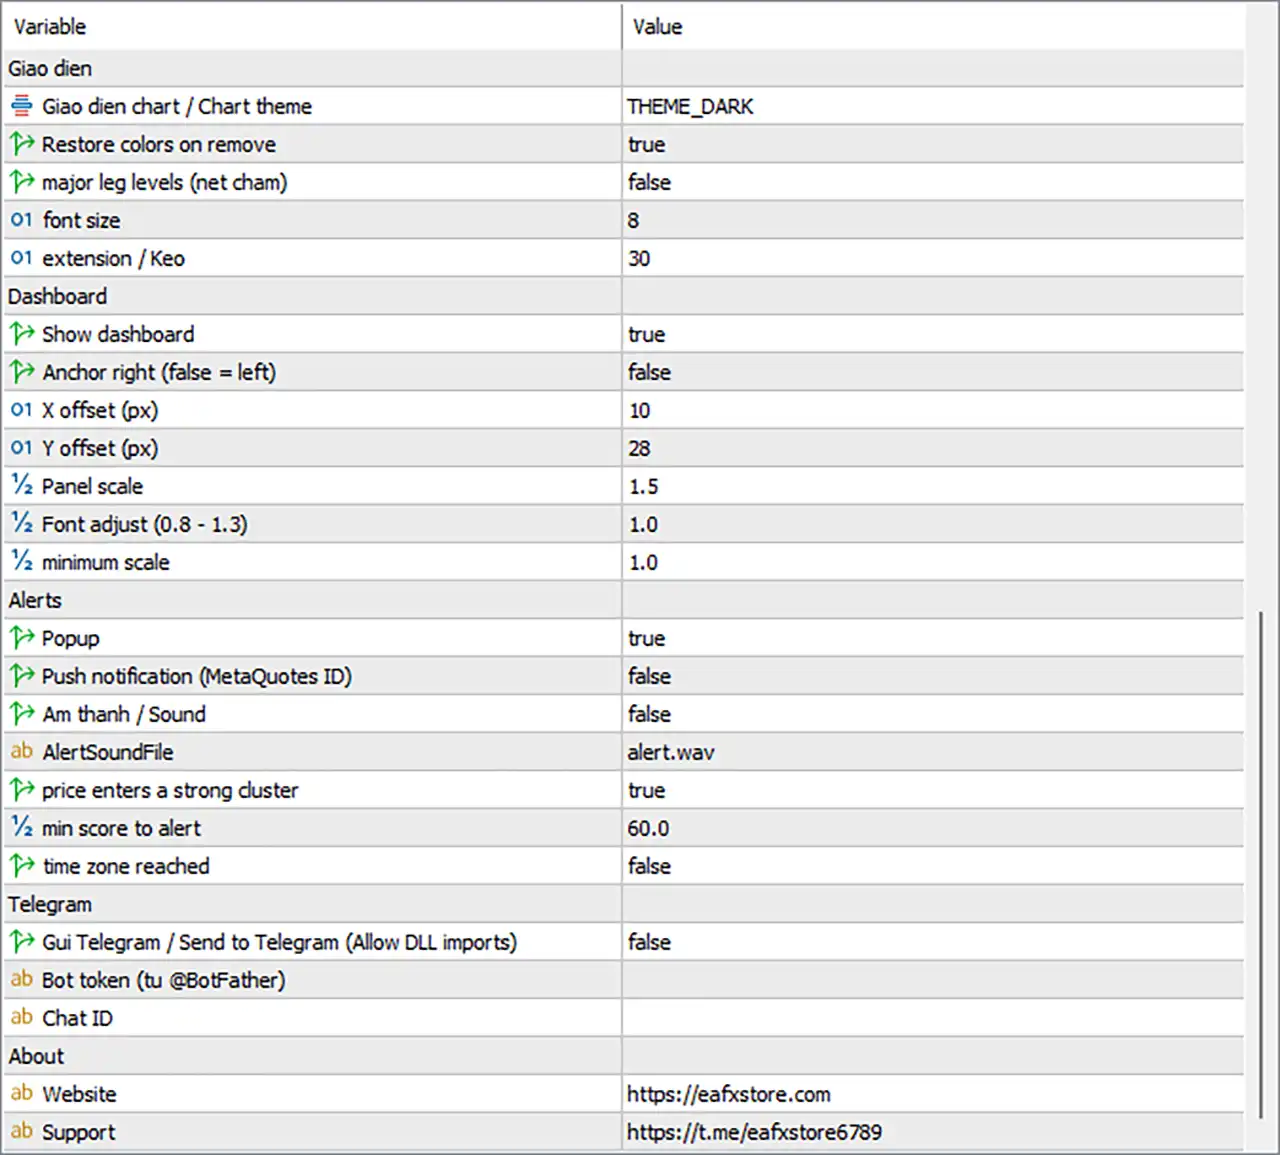
Inputs are grouped into sections. Some group headers and labels contain Vietnamese words from the source code; the table below shows what each group means.
(no group, first line)
Meaning: Performance
Controls: How many bars are calculated
- Licence
Meaning: Licence
Controls: Your licence key
Ngon ngu
Meaning: Language
Controls: Language setting (English-only build)
Swing & leg
Meaning: Swings and legs
Controls: Pivot detection and which swings are used
Fib levels
Meaning: Fibonacci levels
Controls: Which ratios are used and how clusters are formed/drawn
Hop luu ngoai
Meaning: External confluence
Controls: PDH/PDL/PWH/PWL, round numbers, HVN
Time Fibonacci
Meaning: Time Fibonacci
Controls: Forward time zones
Statistics
Meaning: Statistics
Controls: Touch detection and reaction measurement
Giao dien
Meaning: Display / appearance
Controls: Chart theme, labels, zone length
Dashboard
Meaning: Dashboard
Controls: Panel position, size and font
Alerts
Meaning: Alerts
Controls: Popup, push, sound and alert conditions
Telegram
Meaning: Telegram
Controls: Telegram bot settings
About
Meaning: About
Controls: Links used by the dashboard buttons
🔢 Input Reference
Each table lists the input as it appears in MT5 (with the internal variable name in brackets), its default value, and a detailed explanation. “ATR” means the indicator’s own Average True Range with period AtrLen.
⚙️ Performance (first line)
Bars to calculate (0 = all) [MaxBarsCalc]
Default: 3000
What it does and how to set it: Number of most recent bars the indicator processes when it loads. Fewer bars = faster loading and smoother scrolling; 0 processes the entire history (slow on low timeframes). Keep 2000–5000 for normal use. It should be at least as large as bars analysed (MaxHistory) and larger than HVN bars.
⚙️ 0. Licence
Licence key from eafxstore.com [InpLicenseKey]
Default: (empty)
What it does and how to set it: Paste the licence key you received after purchase. Spaces at the start/end are removed and letters are converted to upper case automatically. If this is empty the indicator will not start and shows “Please enter your licence key.” The key is checked against the licence server when the indicator loads and every 30 minutes; if you change trading account it is re-checked for the new account.
⚙️ Ngon ngu (Language)
Language (English only build) [Lang]
Default: LANG_EN
What it does and how to set it: Kept for compatibility. This build displays everything in English, so changing this value has no effect.
⚙️ Swing & leg
pivot length [PivLen]
Default: 6
What it does and how to set it: Number of bars on each side a high/low must beat to be a swing pivot. Higher = fewer, larger swings and slower confirmation (a pivot is confirmed PivLen bars after it forms). Lower = more, smaller swings and more zones. Typical: 4–5 scalping, 6 intraday, 8–10 swing.
pivots used for legs [LegPivots]
Default: 8
What it does and how to set it: How many of the most recent pivots are used to build legs. Every high is paired with every low among them, so this controls how far back in structure the indicator looks. Higher = older swings included (more levels, more history). Typical 6–12.
max legs [MaxLegs]
Default: 12
What it does and how to set it: Maximum number of legs used at the same time (up to 40). More legs = more levels and stronger confluence, but also more noise. Typical 8–15.
min leg size (xATR) [MinLegATR]
Default: 1.5
What it does and how to set it: A leg must be at least this many ATRs tall to be used. This filters out small, meaningless swings. Raise to 2.0–3.0 on noisy or low timeframes; lower to 1.0 in very quiet markets.
ATR [AtrLen]
Default: 14
What it does and how to set it: ATR period. ATR is the unit for leg size, cluster row size, the ±15 ATR search area, reaction size and distances on the dashboard. 14 is standard; there is rarely a reason to change it.
bars analysed [MaxHistory]
Default: 3000
What it does and how to set it: How many recent bars get the full cluster analysis (legs, clusters, touches, statistics). Older bars only contribute pivots. More bars = more statistics but slower calculation. Keep it ≤ Bars to calculate.
⚙️ Fib levels
Retracement 0.236 0.382 0.5 0.618 0.786 0.886 [UseRetrace]
Default: true
What it does and how to set it: Include the six retracement levels of each leg. Turn off only if you want extension-only zones (not recommended).
Extension 1.272 1.414 1.618 2.0 2.618 [UseExtension]
Default: true
What it does and how to set it: Include the five extension levels of each leg. Extensions are useful as profit targets and for finding zones beyond recent highs/lows.
Hang luoi cum = x ATR / cluster row size [ClusterATR]
Default: 0.15
What it does and how to set it: Height of one grid row as a fraction of ATR. Levels that fall in the same or neighbouring rows join the same cluster, and a drawn zone is about 3 rows tall. Smaller = tighter, more precise zones but fewer merges. Larger = wider zones with more levels. Typical 0.10–0.25.
min Fib levels per cluster [MinMembers]
Default: 2
What it does and how to set it: Minimum number of Fibonacci levels (external levels do not count) needed for a cluster. 2 shows more zones; 3 shows only well-confirmed zones.
clusters drawn per side [TopClusters]
Default: 4
What it does and how to set it: Maximum number of zones drawn above price and below price. Only the highest-scoring ones are shown. Use 2–3 for a cleaner chart.
min score to draw [MinScoreShow]
Default: 35
What it does and how to set it: Zones scoring below this (0–100) are not drawn and not shown on the dashboard. The strongest zone on the chart always scores 100. Raise to 45–60 to see only the important zones.
⚙️ Hop luu ngoai (External confluence)
PDH / PDL / PWH / PWL [UseDaily]
Default: true
What it does and how to set it: Adds the previous day high/low and previous week high/low as extra levels. They strengthen any cluster they fall into. On D1 and above these are less meaningful — consider turning off.
round numbers [UseRound]
Default: true
What it does and how to set it: Adds the three round numbers above and three below price (weight 60% of the external weight).
round step [RoundStep]
Default: 0
What it does and how to set it: Distance between round numbers in price units. 0 = automatic (a power of ten based on 4 × ATR). Set manually when the market has a known step, e.g. 0.0050 or 0.0100 on EURUSD, 10 or 50 on XAUUSD, 100 on indices.
HVN tu volume profile 500 bar [UseHVN]
Default: true
What it does and how to set it: Adds the three strongest high-volume nodes from a tick-volume profile. HVNs are prices where the market traded most and often act as support/resistance.
HVN bars [HvnBars]
Default: 500
What it does and how to set it: Number of bars used for the volume profile (the profile is refreshed every 10 bars). More bars = longer-term volume areas. Typical 300–1000.
external weight [WExternal]
Default: 0.8
What it does and how to set it: How much each external level adds to a cluster, compared with a Fibonacci level (a 0.618 of a full-weight leg = 1.0). 0 = external levels ignored in scoring; 1.0–1.5 = give them more influence.
⚙️ Time Fibonacci
time zones [UseTimeFib]
Default: true
What it does and how to set it: Draws Fibonacci time zones (t0.382, t0.618, t1.0, t1.618, t2.0, t2.618) projected from the duration of the major leg, as dotted purple vertical lines.
max bars ahead [TimeMaxBars]
Default: 120
What it does and how to set it: Only time zones within this many bars of the current bar are shown. Lower it to keep the chart tidy; raise it on higher timeframes if you want to see further ahead.
⚙️ Statistics
min cluster score [StatMinScore]
Default: 60
What it does and how to set it: Only clusters with at least this score are checked for touches. This controls the touch dots on the chart, the reaction statistics, the Recent Events list and the cluster-touch alert. Lower = more touches recorded; higher = only strong zones.
bars to resolve [StatBars]
Default: 20
What it does and how to set it: After a touch, how many bars the indicator waits for a reaction. If neither the win nor the loss distance is reached within this window, the touch is neutral and excluded from the win rate.
reaction size [ReactATR]
Default: 1.0
What it does and how to set it: Move required (in ATR) to count a win (in the expected direction) or a loss (against it). Larger = stricter test of the zones.
⚙️ Giao dien (Display)
Giao dien chart / Chart theme [Theme]
Default: THEME_DARK
What it does and how to set it: Chart colour theme applied when the indicator loads: THEME_NONE (keep your colours), THEME_DARK, THEME_MIDNIGHT or THEME_LIGHT. The theme also switches the chart to candles and hides the grid (Light keeps the grid).
Restore colors on remove [RestoreTheme]
Default: true
What it does and how to set it: When the indicator is removed, your original chart colours are restored. Set false to keep the theme permanently.
major leg levels (net cham) [ShowMajorFib]
Default: false
What it does and how to set it: Also draws the six retracement levels of the major leg as dotted grey lines (“net cham” = dotted line). The major leg itself is always drawn as a gold dashed line.
font size [LabelFont]
Default: 8
What it does and how to set it: Font size of the text labels on the chart (cluster scores/composition, time zone labels). Increase on high-resolution screens.
extension / Keo [ExtendBars]
Default: 30
What it does and how to set it: How many bars into the future the cluster zones and labels extend beyond the current bar (“Keo” = extend). Zones start 40 bars back. Increase if labels are cut off at the right edge.
⚙️ Dashboard
Show dashboard [ShowDash]
Default: true
What it does and how to set it: Shows or hides the information panel. Zones, markers and alerts keep working when it is hidden.
Anchor right (false = left) [DashRight]
Default: false
What it does and how to set it: false = panel in the top-left corner; true = top-right corner.
X offset (px) [DashX]
Default: 10
What it does and how to set it: Horizontal distance in pixels from the chosen side of the chart.
Y offset (px) [DashY]
Default: 28
What it does and how to set it: Vertical distance in pixels from the top of the chart.
Panel scale [DashScale]
Default: 1.5
What it does and how to set it: Size of the panel. The indicator automatically reduces it so the panel fits the chart height and takes at most 45% of the chart width. Typical 1.0–1.6.
Font adjust (0.8 - 1.3) [DashFontAdj]
Default: 1.0
What it does and how to set it: Fine-tunes text size inside the panel without changing its layout. Use 0.9 if text looks crowded, 1.1–1.2 if it is too small.
minimum scale [DashMinScale]
Default: 1.0
What it does and how to set it: The panel will never shrink below this scale, even on a small chart. Lower it (e.g. 0.7) if the panel is too big for small chart windows.
Moving the dashboard
Click and drag the panel by its header to move it. The new position is remembered for that chart and overrides Anchor right / X offset / Y offset until those saved positions are cleared (Tools → Global Variables, delete the entries starting with OMFIB_DASH).
⚙️ Alerts
Popup [AlertPopup]
Default: true
What it does and how to set it: Shows a MetaTrader alert window with sound when an alert fires.
Push notification (MetaQuotes ID) [AlertPush]
Default: false
What it does and how to set it: Sends the alert to the MetaTrader app on your phone. Requires your MetaQuotes ID in Tools → Options → Notifications.
Am thanh / Sound [AlertSoundOn]
Default: false
What it does and how to set it: Plays a sound file when an alert fires (“Am thanh” = sound).
AlertSoundFile [AlertSoundFile]
Default: alert.wav
What it does and how to set it: Name of the sound file to play. It must exist in the terminal’s Sounds folder.
price enters a strong cluster [AlertTouch]
Default: true
What it does and how to set it: Alert when a closed bar enters a cluster from outside (touch). Only clusters with score ≥ min cluster score (StatMinScore) are detected.
min score to alert [AlertMinScore]
Default: 60
What it does and how to set it: Minimum cluster score for a touch alert. Must be equal to or higher than StatMinScore to have any effect — a lower value behaves the same as StatMinScore.
time zone reached [AlertTime]
Default: false
What it does and how to set it: Alert when a Fibonacci time zone is reached.
When alerts fire
Alerts are checked when a bar closes, not during the bar, and only while the chart is running live — never while historical bars are being calculated. At most one touch is reported per bar, with at least 3 bars between touches.
⚙️ Telegram
Gui Telegram / Send to Telegram (Allow DLL imports) [TgEnable]
Default: false
What it does and how to set it: Sends every alert to Telegram as well (“Gui” = send). Needs Allow DLL imports. When enabled, a TEST TG button appears on the dashboard.
Bot token (tu @BotFather) [TgToken]
Default: (empty)
What it does and how to set it: The token of your Telegram bot, obtained from @BotFather (“tu” = from).
Chat ID [TgChatID]
Default: (empty)
What it does and how to set it: The ID of the chat, group or channel that receives messages. For a group or channel the ID usually starts with -100. Add your bot to the group/channel first (as an admin for channels).
Setting up Telegram step by step
- In Telegram, open @BotFather, send /newbot, follow the prompts and copy the bot token.
- Open a chat with your new bot and send any message (or add the bot to your group/channel).
- Get your Chat ID, for example by messaging a helper bot such as @userinfobot, or by opening https://api.telegram.org/bot<TOKEN>/getUpdates in a browser after step 2.
- Enter the token and Chat ID, set Send to Telegram to true and click OK.
- Click TEST TG on the dashboard. A popup confirms success; if it fails, the reason is printed in the Experts tab.
⚙️ About
Website [AboutWeb]
Default: https://eafxstore.com
What it does and how to set it: Address opened by the WEB button on the dashboard.
Support [AboutTelegram]
Default: https://t.me/eafxstore6789
What it does and how to set it: Address opened by the TELEGRAM button on the dashboard.
🔢 Quick Presets
MinScoreShow
Clean chart: 55
Default: 35
Maximum detail: 25
TopClusters
Clean chart: 2
Default: 4
Maximum detail: 6
MinMembers
Clean chart: 3
Default: 2
Maximum detail: 2
ClusterATR
Clean chart: 0.12
Default: 0.15
Maximum detail: 0.20
MaxLegs
Clean chart: 8
Default: 12
Maximum detail: 20
ShowMajorFib
Clean chart: false
Default: false
Maximum detail: true
UseTimeFib
Clean chart: false
Default: true
Maximum detail: true
🔢 Troubleshooting
“Please enter your licence key.”
Solution: Enter the key in the Licence key input.
“Please tick Allow DLL imports…”
Solution: Enable Allow DLL imports in Tools → Options → Expert Advisors and in the Common tab of the indicator.
“Cannot reach the licence server.”
Solution: Check your internet connection and firewall. If there was a successful check in the last 72 hours the indicator keeps running.
“System clock check failed.”
Solution: Set your computer clock to the correct time and date (automatic time sync is recommended).
Nothing drawn on the chart
Solution: The chart needs enough history (roughly 100+ bars). Lower MinLegATR or MinScoreShow, or scroll back to load more history.
“Licence: re-checking for the new account…”
Solution: Shown after switching trading account. Wait for the next tick; the licence is re-checked automatically.
Telegram test fails
Solution: Check the token and Chat ID, make sure you sent the bot a message first (or added it to the group/channel), and that DLL imports are allowed.
Dashboard too large / small
Solution: Adjust Panel scale, Font adjust and minimum scale.
Chart colours changed
Solution: Set Chart theme to THEME_NONE, or keep Restore colors on remove = true.