

🔢 Omega Footprint Book – Inputs Setup Guide
⚙️ Installation
🔹 In MetaTrader 5 open File → Open Data Folder, then go to MQL5Indicators.
🔹 Copy the indicator file into that folder. If you received the source file (.mq5), open it in MetaEditor and press F7 (Compile) to create the .ex5 file.
🔹 Back in MT5, right-click Indicators in the Navigator window and choose Refresh.
🔹 Enable DLLs globally: Tools → Options → Expert Advisors → tick “Allow DLL imports”. The licence check and Telegram alerts need the Windows internet library (wininet.dll); the WEB/TELEGRAM buttons use shell32.dll.
🔹 Drag Omega Footprint Book onto a chart. On the Common tab, make sure “Allow DLL imports” is ticked.
🔹 On the Inputs tab, paste your licence key into InpLicenseKey, adjust any other settings, and click OK.
🔹 Check the Experts tab of the Toolbox: a successful start prints “Licence: Licence OK …” followed by the range POC and Value Area.
If the indicator does not start
“Please enter your licence key.” — the key field is empty.
“Please tick ‘Allow DLL imports’ …” — DLLs are disabled in Options or on the Common tab.
“Cannot reach the licence server.” — no internet or a firewall blocks license.eafxstore.com; the indicator keeps running on its offline grace token if one exists.
Any other reason text comes from the licence server (e.g. expired or blocked key) — contact support with the message shown.
⚙️ How to Read This Guide
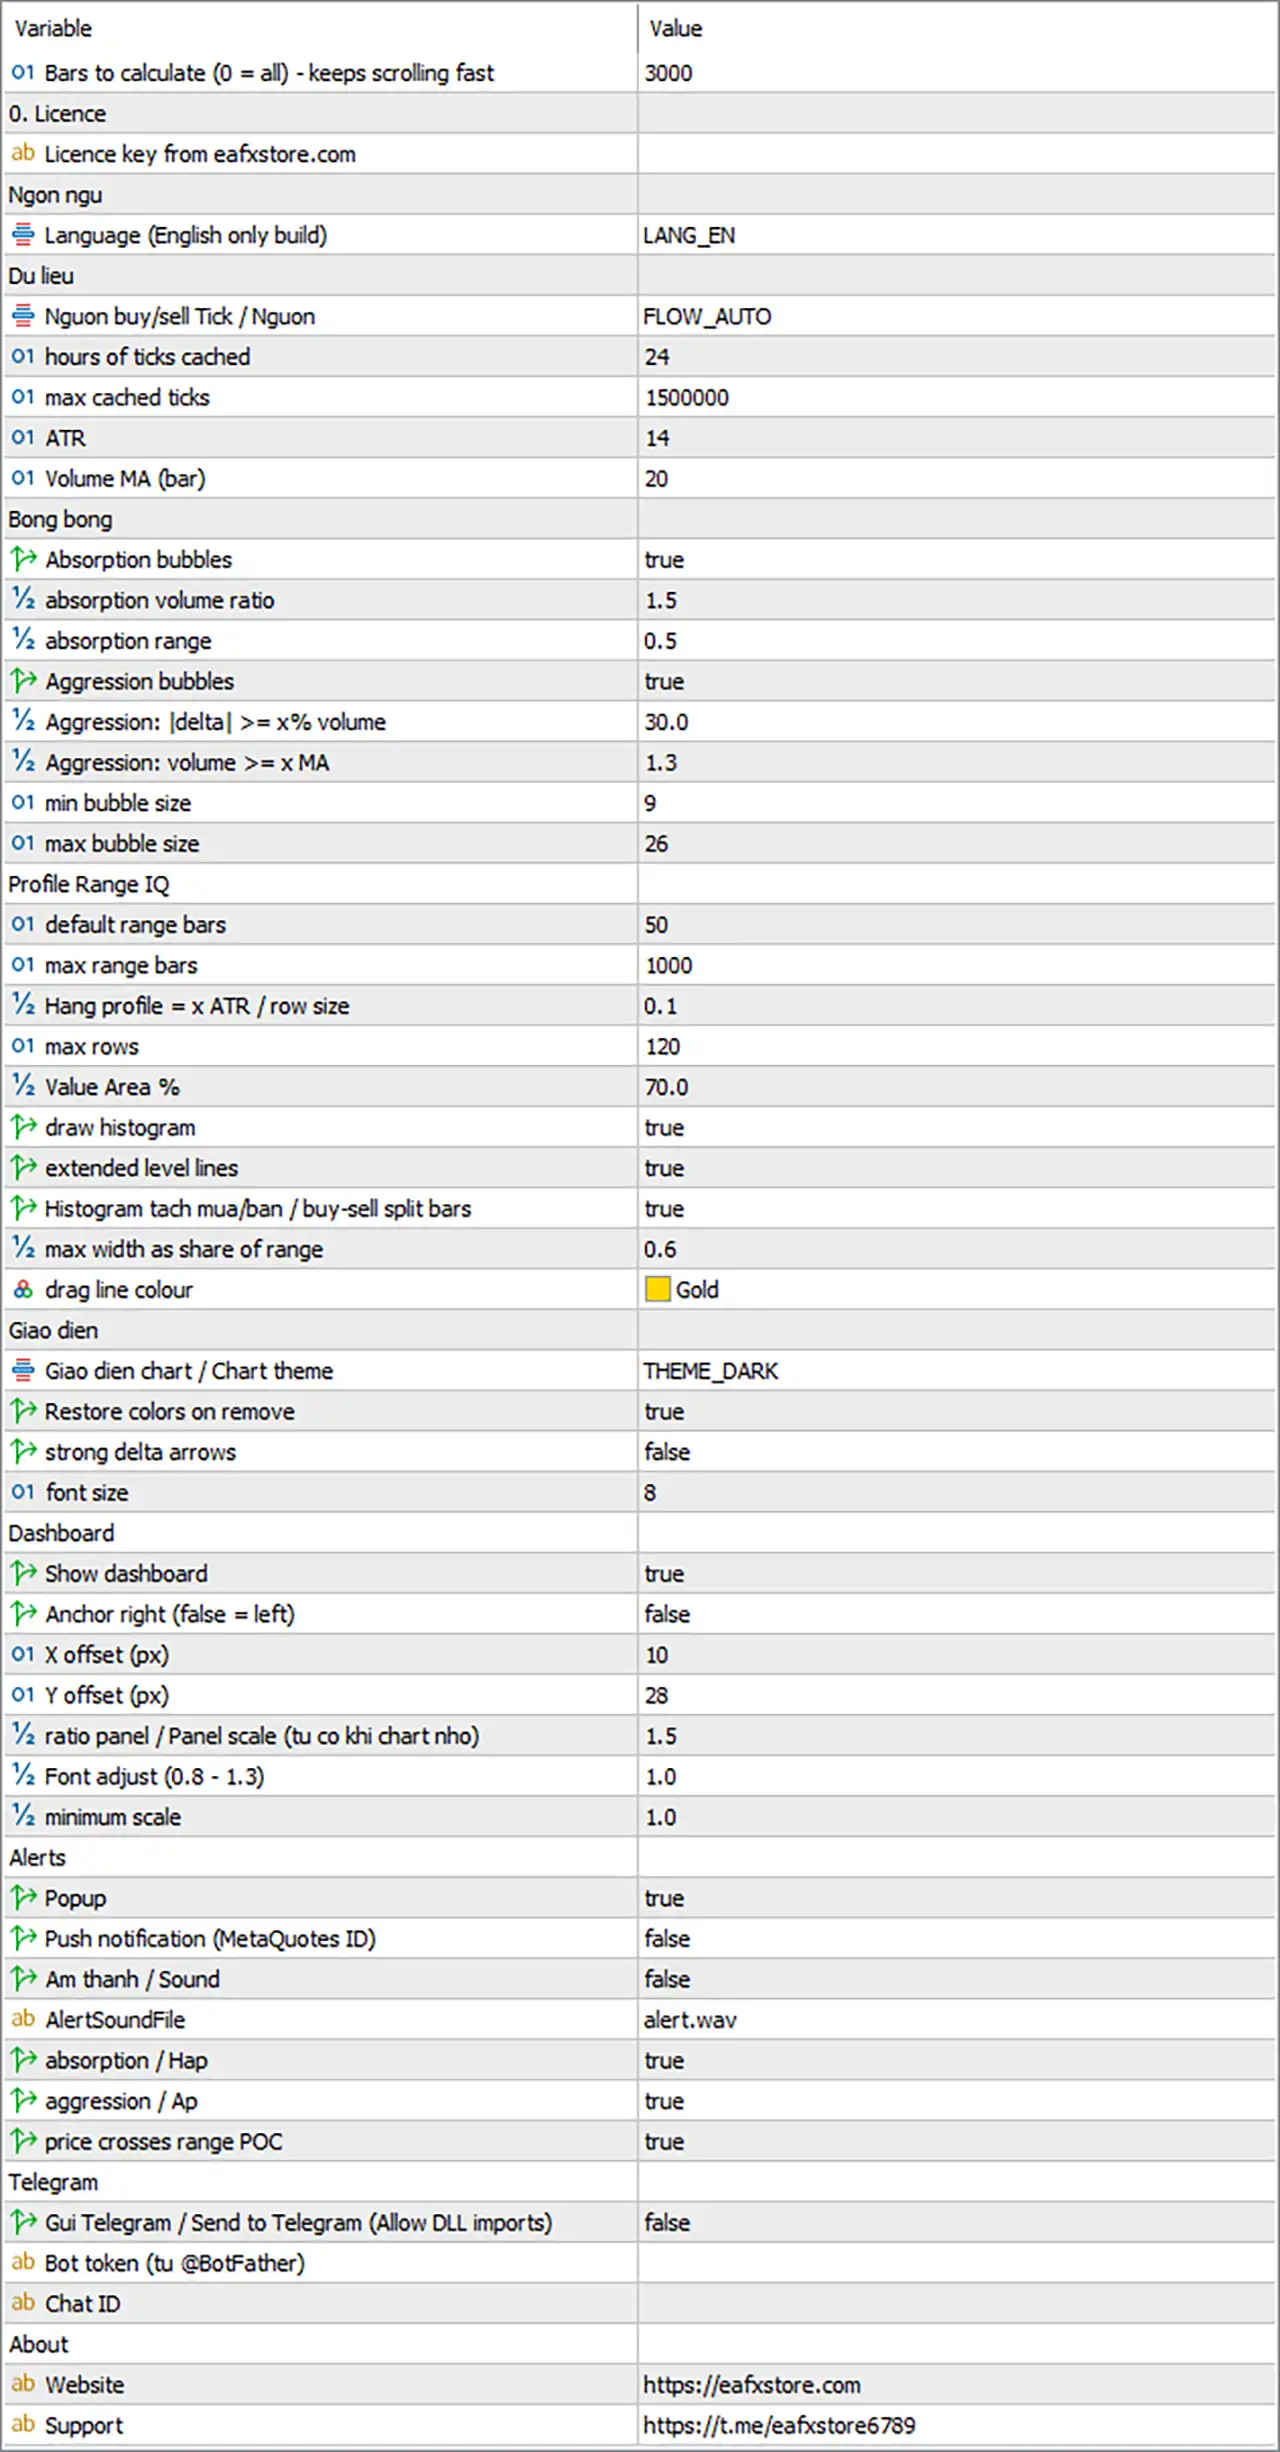
The Inputs tab is divided into groups. Some group and label texts in the tab still contain Vietnamese words from the original build; this guide shows the label exactly as it appears, followed by its meaning. Each parameter is described with:
🔹 Shown in Inputs as — the text you see in the Inputs tab.
🔹 Type / default — the kind of value and the factory setting.
🔹 What it does — how the indicator uses it internally.
🔹 Recommendation — sensible values and when to change them.
🔹 (no group, first line): Meaning = Calculation depth; Section = 3
🔹 Licence: Meaning = Licence; Section = 4
🔹 Ngon ngu: Meaning = Language; Section = 5
🔹 Du lieu: Meaning = Data; Section = 6
🔹 Bong bong: Meaning = Bubbles; Section = 7
🔹 Profile Range IQ: Meaning = Range volume profile; Section = 8
🔹 Giao dien: Meaning = Appearance; Section = 9
🔹 Dashboard: Meaning = Dashboard; Section = 10
🔹 Alerts: Meaning = Alerts; Section = 11
🔹 Telegram: Meaning = Telegram; Section = 12
🔹 About: Meaning = Links; Section = 13
⚙️ Calculation Depth
MaxBarsCalc
Shown in Inputs as: Bars to calculate (0 = all) - keeps scrolling fast
Type / default: Integer · default 3000
What it does: Number of most recent candles analysed when the indicator loads. Candles older than this get no buy/sell split, no bubbles and no ATR.
0 = analyse the whole history (slower on long histories).
If the profile lines are placed on candles outside this depth, those candles contribute their volume split 50/50.
Recommendation: 2000–5000. Keep it larger than the widest range you plan to profile. Raise only if you need bubbles further back — remember bubbles also require tick data (see TickHours).
⚙️ 0. Licence
InpLicenseKey
Shown in Inputs as: Licence key from eafxstore.com
Type / default: Text · default (empty)
What it does: Your licence key. Spaces are trimmed and the key is converted to upper case automatically.
Verified with the licence server at start-up and every 30 minutes, tied to the trading account number. Changing account triggers an immediate re-check.
If the server cannot be reached, a signed offline token allows the indicator to keep running for the grace period (72 h by default). Setting the computer clock backwards cancels the grace period.
Recommendation: Paste the key exactly as received. One licence per trading account unless your plan says otherwise.
⚙️ Ngon ngu (Language)
Lang
Shown in Inputs as: Language (English only build)
Type / default: List: LANG_VI / LANG_EN · default LANG_EN
What it does: This build displays all text in English. The setting is kept for compatibility and changing it has no visible effect.
Recommendation: Leave at LANG_EN.
⚙️ Du lieu (Data)
FlowMode
Shown in Inputs as: Nguon buy/sell Tick / Nguon (buy/sell data source)
Type / default: List: FLOW_AUTO / FLOW_TICK / FLOW_OHLC · default FLOW_AUTO
What it does: FLOW_AUTO — use tick data where available (trade flags first, otherwise the tick rule); fall back to the candle estimate where ticks are missing.
FLOW_TICK — in version 1.0 behaves the same as AUTO (ticks where available, estimate elsewhere).
FLOW_OHLC — never load ticks. Buy volume = volume × (close − low)/(high − low). Fastest and lightest, but no bubbles are drawn because they require tick data.
Recommendation: FLOW_AUTO for normal use. FLOW_OHLC only on a very weak VPS or if you want the profile without bubbles.
TickHours
Shown in Inputs as: hours of ticks cached
Type / default: Integer (hours) · default 24
What it does: How many hours of tick history are loaded into memory in a single request. Only candles inside this window receive tick-based buy/sell (and can show bubbles); older candles use the estimate.
The cache is refreshed automatically as new candles close.
Recommendation: M1–M5: 24–48. M15–H1: 48–120. Higher values take longer to load and need a larger MaxTicks. On weekends/Mondays increase it so the window reaches back to last week’s trading.
MaxTicks
Shown in Inputs as: max cached ticks
Type / default: Integer · default 1,500,000
What it does: Upper limit on cached ticks. If more ticks are returned, the oldest are dropped so the most recent history is kept.
Each tick takes roughly 60 bytes, so 1.5 million ticks use about 90 MB of RAM per chart.
Recommendation: Raise to 2–3 million for busy symbols (gold, indices, crypto) with long TickHours. Lower to 500,000 on a small VPS running many charts.
AtrLen
Shown in Inputs as: ATR
Type / default: Integer (bars) · default 14
What it does: Period of the ATR (Wilder smoothing). ATR is the yardstick for: the absorption range limit, the 0.8 × ATR minimum range for aggression, bubble offset from the candle, and the height of profile rows (RowATR × ATR).
Recommendation: 14 is standard. Use 10 for faster adaptation on scalping charts, 20 for smoother values on H1–H4.
VolMA
Shown in Inputs as: Volume MA (bar)
Type / default: Integer (bars) · default 20
What it does: Number of previous candles averaged to get the “normal” tick volume. Absorption and aggression volume thresholds, and bubble size, are all ratios to this average.
Recommendation: 20 works on most timeframes. Use 30–50 on M1 to reduce noise from single busy minutes.
⚙️ Bong bong (Bubbles)
ShowAbsorb
Shown in Inputs as: Absorption bubbles
Type / default: true / false · default true
What it does: Shows hollow circles (○) at the midpoint of absorption candles: high volume with a small range. Green = selling absorbed (bullish), red = buying absorbed (bearish).
Recommendation: Keep on — this is the core signal of the indicator.
AbsVolX
Shown in Inputs as: absorption volume ratio
Type / default: Decimal (× average) · default 1.5
What it does: A candle can only be absorption if its volume is at least this multiple of the VolMA average.
Recommendation: 1.3–2.0. Lower = more bubbles (more noise); higher = only the heaviest candles.
AbsRangeATR
Shown in Inputs as: absorption range
Type / default: Decimal (× ATR) · default 0.5
What it does: Maximum candle range (high − low) for absorption, as a fraction of ATR. Heavy volume inside a narrow candle = price is being held.
Recommendation: 0.4–0.7. Increase slightly on higher timeframes where candles are naturally wider relative to ATR.
ShowAggress
Shown in Inputs as: Aggression bubbles
Type / default: true / false · default true
What it does: Shows filled circles (●): green below the candle for aggressive buying, red above for aggressive selling. If a candle qualifies as both, it is shown as absorption.
Recommendation: Keep on. Turn off if you only want absorption signals.
AggDeltaPct
Shown in Inputs as: Aggression: |delta| >= x% volume
Type / default: Decimal (%) · default 30
What it does: Minimum imbalance for aggression: |buy − sell| must be at least this percentage of the candle’s volume.
Also used as the threshold for delta arrows (ShowDeltaArrows) and for highlighting the Last Bar Delta card on the dashboard.
Recommendation: 25–35 on M1–M15; 20–25 on H1 and above, where delta tends to be more balanced.
AggVolX
Shown in Inputs as: Aggression: volume >= x MA
Type / default: Decimal (× average) · default 1.3
What it does: Minimum volume for aggression as a multiple of the VolMA average. The candle must also have a range of at least 0.8 × ATR (fixed).
Recommendation: 1.2–1.6.
BubbleMin
Shown in Inputs as: min bubble size
Type / default: Integer (font points) · default 9
What it does: Bubble size for a candle at average volume.
Recommendation: 8–12 depending on screen resolution.
BubbleMax
Shown in Inputs as: max bubble size
Type / default: Integer (font points) · default 26
What it does: Bubble size for candles at 4× average volume or more. Sizes in between scale linearly with the volume ratio.
Recommendation: 20–30. Reduce on zoomed-out charts so bubbles do not cover candles.
⚙️ Profile Range IQ
The profile is built between two gold vertical lines. Drag either line to a new candle and the profile, dashboard and levels update immediately. Line positions are saved per chart and restored after restarts or timeframe changes.
DefaultRange
Shown in Inputs as: default range bars
Type / default: Integer (bars) · default 50
What it does: When a chart has no saved range, the start line is placed this many candles back from the latest candle and the end line on the latest candle.
Recommendation: 40–100. Just a starting point — you will normally drag the lines.
MaxRangeBars
Shown in Inputs as: max range bars
Type / default: Integer (bars) · default 1000
What it does: Maximum candles in a profile. If the lines are further apart, the start is moved forward to fit.
Recommendation: 500–1500. Very wide ranges on low timeframes are slower to redraw.
RowATR
Shown in Inputs as: Hang profile = x ATR / row size
Type / default: Decimal (× ATR) · default 0.1
What it does: Height of one profile row = RowATR × ATR of the last closed candle. Smaller values give a finer profile.
If the range would need more than MaxRows rows, the row height is enlarged automatically.
Recommendation: 0.10 for M1–M15, 0.15–0.20 for H1–H4.
MaxRows
Shown in Inputs as: max rows
Type / default: Integer · default 120
What it does: Maximum number of price rows in the profile (internal hard limit 400).
Recommendation: 80–150. More rows = more chart objects and slightly slower redraws.
ValueArea
Shown in Inputs as: Value Area %
Type / default: Decimal (%) · default 70
What it does: Share of the range volume contained in the Value Area. Starting at the POC, the larger neighbouring row is added each step until this share is reached, giving VAH and VAL.
Recommendation: 70 is the market-profile standard; 68 or 80 are also used.
ShowProfile
Shown in Inputs as: draw histogram
Type / default: true / false · default true
What it does: Draws the horizontal histogram inside the range. When off, levels and dashboard still work.
Recommendation: On, unless the chart is too crowded.
ShowLevels
Shown in Inputs as: extended level lines
Type / default: true / false · default true
What it does: Draws POC (solid gold), VAH and VAL (dotted blue) from the start of the range to ten candles past its end, with price labels.
Recommendation: On.
SplitBuySell
Shown in Inputs as: Histogram tach mua/ban / buy-sell split bars
Type / default: true / false · default true
What it does: On: each row shows its buy portion (green) followed by its sell portion (red). Off: one bar per row in a single blue tone. The POC row is gold in both modes; Value Area rows are brighter than rows outside it.
Recommendation: On — the split shows who traded at each level.
ProfileWidth
Shown in Inputs as: max width as share of range
Type / default: Decimal (0–1) · default 0.6
What it does: Length of the longest row (the POC) as a fraction of the range’s time width. Other rows are proportional.
Recommendation: 0.4–0.8.
LineColor
Shown in Inputs as: drag line colour
Type / default: Colour · default Gold
What it does: Colour of the two draggable range lines.
Recommendation: Any colour that stands out against your chart background.
⚙️ Giao dien (Appearance)
Theme
Shown in Inputs as: Giao dien chart / Chart theme
Type / default: List: NONE / DARK / MIDNIGHT / LIGHT · default THEME_DARK
What it does: Applies a colour scheme to the chart and switches it to candlesticks with period separators hidden.
THEME_NONE keeps your chart exactly as it is.
Recommendation: DARK or MIDNIGHT match the dashboard colours. Choose NONE if you use a saved template.
RestoreTheme
Shown in Inputs as: Restore colors on remove
Type / default: true / false · default true
What it does: Restores your original chart colours and chart type when the indicator is removed.
Recommendation: On.
ShowDeltaArrows
Shown in Inputs as: strong delta arrows
Type / default: true / false · default false
What it does: Draws an up arrow under candles whose delta is ≥ AggDeltaPct % and a down arrow above candles ≤ −AggDeltaPct %.
Recommendation: Off by default to keep the chart clean; turn on to see every strong-delta candle, not only those that pass the aggression volume filter.
LabelFont
Shown in Inputs as: font size
Type / default: Integer (points) · default 8
What it does: Font size of the range label and POC/VAH/VAL price labels on the chart (not the dashboard).
Recommendation: 8–10.
⚙️ Dashboard
ShowDash
Shown in Inputs as: Show dashboard
Type / default: true / false · default true
What it does: Shows or hides the dashboard panel.
Recommendation: On.
DashRight
Shown in Inputs as: Anchor right (false = left)
Type / default: true / false · default false
What it does: Anchors the panel to the right edge of the chart instead of the left.
Recommendation: Right if you keep price action on the left.
DashX
Shown in Inputs as: X offset (px)
Type / default: Integer (pixels) · default 10
What it does: Horizontal distance from the anchored edge.
Recommendation: 10–20.
DashY
Shown in Inputs as: Y offset (px)
Type / default: Integer (pixels) · default 28
What it does: Vertical distance from the top of the chart.
Recommendation: 20–40 so the panel does not cover the symbol caption.
Dragging overrides DashX / DashY
You can drag the panel by its header. The new position is saved for that chart and takes priority over DashX, DashY and DashRight. To go back to the input values, press F3 (Global Variables) and delete the variables whose names start with OMFOOT_DASHX_ and OMFOOT_DASHY_.
DashScale
Shown in Inputs as: ratio panel / Panel scale (tu co khi chart nho)
Type / default: Decimal · default 1.5
What it does: Preferred size of the panel. It is reduced automatically so the panel fits the chart height and uses at most 45% of the chart width.
Recommendation: 1.2–1.5 on Full-HD, 1.5–2.0 on 2K/4K screens.
DashFontAdj
Shown in Inputs as: Font adjust (0.8 - 1.3)
Type / default: Decimal · default 1.0
What it does: Multiplies all dashboard font sizes. Text that does not fit is shortened with “..”.
Recommendation: 0.9–1.1.
DashMinScale
Shown in Inputs as: minimum scale
Type / default: Decimal · default 1.0
What it does: Smallest size the automatic shrinking may use (never below 0.55). With the default 1.0 the panel does not shrink below normal size, so on small charts it may extend past the chart edge.
Recommendation: 0.7–0.8 on laptops or when several charts are tiled.
⚙️ Alerts
Alerts are raised only when a candle closes during live operation, never while history is being calculated. Each alert text contains the symbol, timeframe, event and details (price, volume ratio, delta).
AlertPopup
Shown in Inputs as: Popup
Type / default: true / false · default true
What it does: Shows the standard MT5 alert window with sound.
Recommendation: On while at the screen.
AlertPush
Shown in Inputs as: Push notification (MetaQuotes ID)
Type / default: true / false · default false
What it does: Sends the alert to the MetaTrader mobile app. Requires your MetaQuotes ID in Tools → Options → Notifications with notifications enabled.
Recommendation: On if you trade away from the desk.
AlertSoundOn
Shown in Inputs as: Am thanh / Sound
Type / default: true / false · default false
What it does: Plays the sound file below.
Recommendation: Optional.
AlertSoundFile
Shown in Inputs as: AlertSoundFile
Type / default: Text · default alert.wav
What it does: Sound file to play; must be in the terminal’s Sounds folder.
Recommendation: Any .wav file you have placed there.
AlertAbsorb
Shown in Inputs as: absorption / Hap
Type / default: true / false · default true
What it does: Alert when a new absorption bubble appears.
Recommendation: On.
AlertAggress
Shown in Inputs as: aggression / Ap
Type / default: true / false · default true
What it does: Alert when a new aggression bubble appears.
Recommendation: On, or off on M1 if too frequent.
AlertPOC
Shown in Inputs as: price crosses range POC
Type / default: true / false · default true
What it does: Alert when a closed candle finishes on the other side of the range POC compared with the previous candle. After you move the range lines, the first candle only sets the reference side.
Recommendation: On when you trade POC tests.
⚙️ Telegram
TgEnable
Shown in Inputs as: Gui Telegram / Send to Telegram (Allow DLL imports)
Type / default: true / false · default false
What it does: Sends every alert to Telegram as well. When on, a TEST TG button appears in the dashboard footer to send a test message.
Recommendation: On after entering the token and chat ID.
TgToken
Shown in Inputs as: Bot token (tu @BotFather)
Type / default: Text · default (empty)
What it does: Token of your Telegram bot, created with @BotFather (format 123456789:ABC…).
Recommendation: Keep it private.
TgChatID
Shown in Inputs as: Chat ID
Type / default: Text · default (empty)
What it does: Where messages are sent: your user ID for private messages, a group ID (starts with −) or a channel. For groups and channels, add the bot as a member/admin first.
Recommendation: Press TEST TG to confirm; failures are explained in the Experts tab.
Telegram setup in four steps
Open @BotFather in Telegram, send /newbot, follow the prompts and copy the token.
Start a chat with your new bot (press Start) or add it to your group/channel.
Get the chat ID (for example with a bot such as @userinfobot, or from the Bot API getUpdates response).
Enter TgToken and TgChatID, set TgEnable = true, then press TEST TG on the dashboard.
⚙️ About
AboutWeb
Shown in Inputs as: Website
Type / default: Text (URL) · default https://eafxstore.com
What it does: Address opened by the WEB button in the dashboard footer.
Recommendation: Leave as is.
AboutTelegram
Shown in Inputs as: Support
Type / default: Text (URL) · default https://t.me/eafxstore6789
What it does: Address opened by the TELEGRAM button.
Recommendation: Leave as is.
🔢 Quick Presets
Starting points by trading style. Parameters not listed keep their defaults.
🔹 TickHours: Scalping (M1–M5) = 24; Intraday (M15–H1) = 72; Swing (H4) = 120
🔹 MaxTicks: Scalping (M1–M5) = 1,500,000; Intraday (M15–H1) = 2,500,000; Swing (H4) = 3,000,000
🔹 VolMA: Scalping (M1–M5) = 30; Intraday (M15–H1) = 20; Swing (H4) = 20
🔹 AbsVolX: Scalping (M1–M5) = 1.5; Intraday (M15–H1) = 1.5; Swing (H4) = 1.3
🔹 AbsRangeATR: Scalping (M1–M5) = 0.5; Intraday (M15–H1) = 0.5; Swing (H4) = 0.6
🔹 AggDeltaPct: Scalping (M1–M5) = 30; Intraday (M15–H1) = 25; Swing (H4) = 20
🔹 AggVolX: Scalping (M1–M5) = 1.3; Intraday (M15–H1) = 1.3; Swing (H4) = 1.2
🔹 RowATR: Scalping (M1–M5) = 0.10; Intraday (M15–H1) = 0.15; Swing (H4) = 0.20
🔹 DefaultRange: Scalping (M1–M5) = 60; Intraday (M15–H1) = 50; Swing (H4) = 40
🔹 MaxBarsCalc: Scalping (M1–M5) = 3000; Intraday (M15–H1) = 3000; Swing (H4) = 2000
🔢 Troubleshooting
🔹 Dashboard shows “(loading ticks...)”: Tick history is still downloading from the broker. The indicator retries in the background and recalculates automatically once ticks arrive.
🔹 Source shows OHLC and no bubbles: Candles are outside the tick window or FlowMode = OHLC. Increase TickHours (and MaxTicks) or set FlowMode = AUTO.
🔹 Source shows e.g. “TICK 120/200”: Only part of the range has tick data. Increase TickHours or move the start line into the tick window.
🔹 Too many bubbles: Raise AbsVolX / AggVolX / AggDeltaPct, or lower AbsRangeATR.
🔹 Dashboard too big or cut off: Lower DashScale and set DashMinScale to 0.7.
🔹 Telegram test fails: Check token, chat ID, internet and “Allow DLL imports”; the exact error is printed in the Experts tab.
🔹 Chart colours changed: Theme is active. Set Theme = THEME_NONE, or remove the indicator with RestoreTheme = true.