In the world of Forex trading, timing is everything. Enter too early, and you risk unnecessary drawdown. Enter too late, and you miss the best part of the move. This is where supply and demand zones come into play—one of the most powerful yet often misunderstood concepts in technical analysis.
Unlike traditional indicators that lag behind price, supply and demand zones focus on where price is likely to react in the future, giving traders a strategic edge. In this guide, you’ll learn what these zones are, how they form, and how to use them to improve your entries.
What Are Supply & Demand Zones?
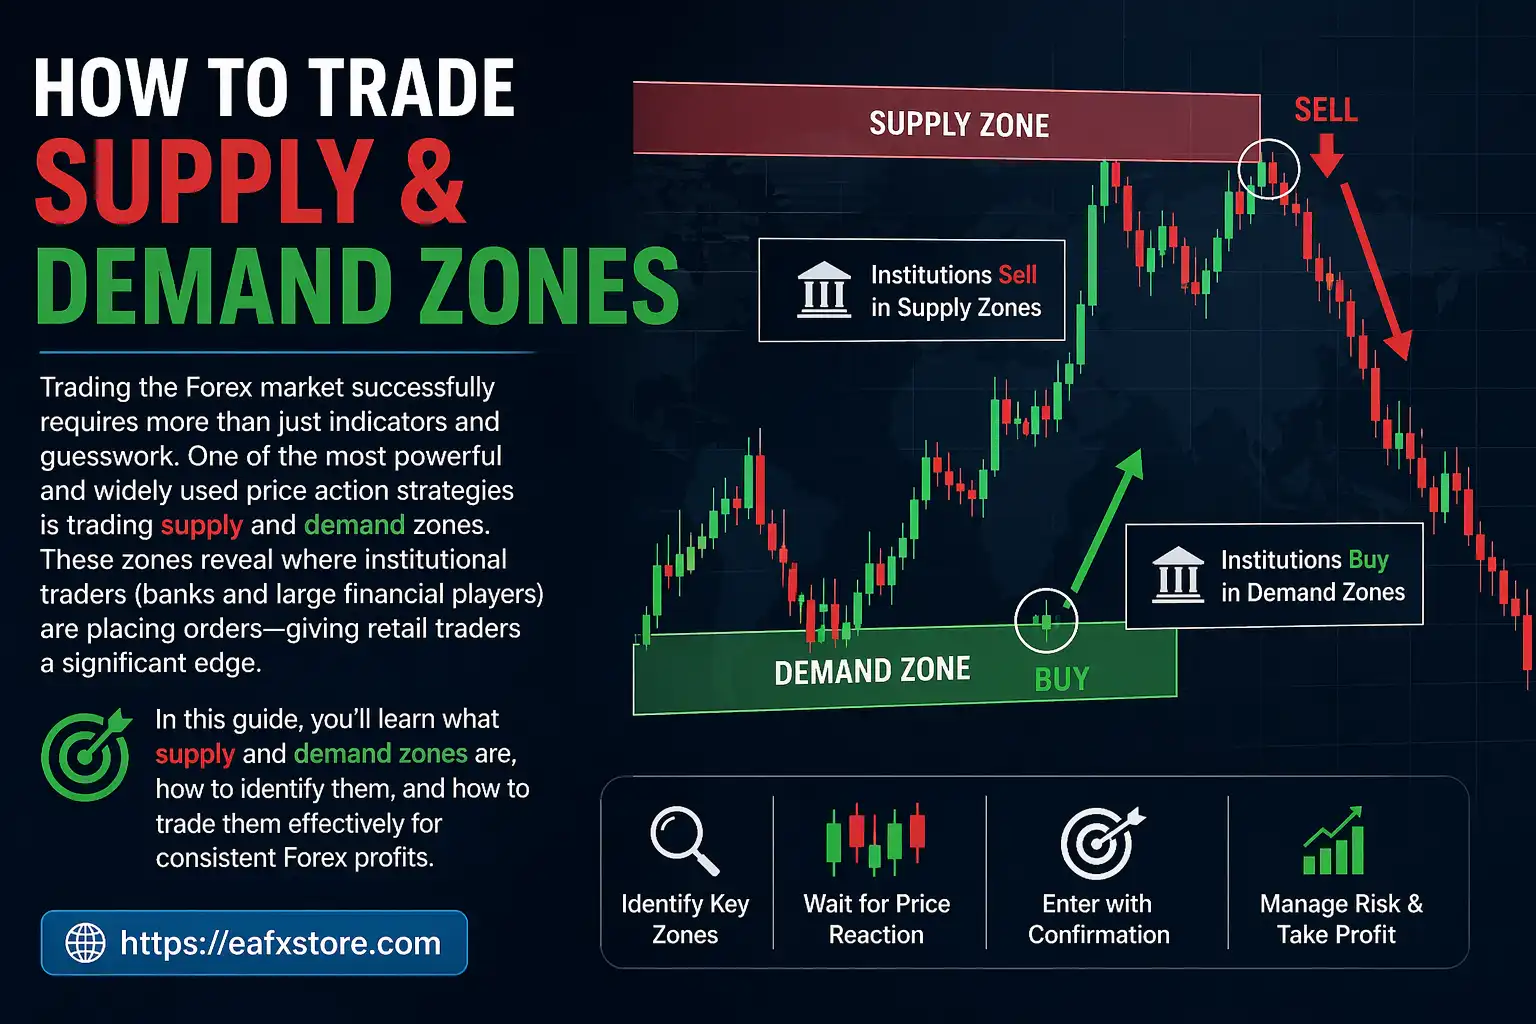
Supply and demand zones are areas on a chart where price has previously made strong moves due to an imbalance between buyers and sellers.
- Demand Zone: An area where buying pressure exceeds selling pressure, causing price to rise.
- Supply Zone: An area where selling pressure exceeds buying pressure, causing price to fall.
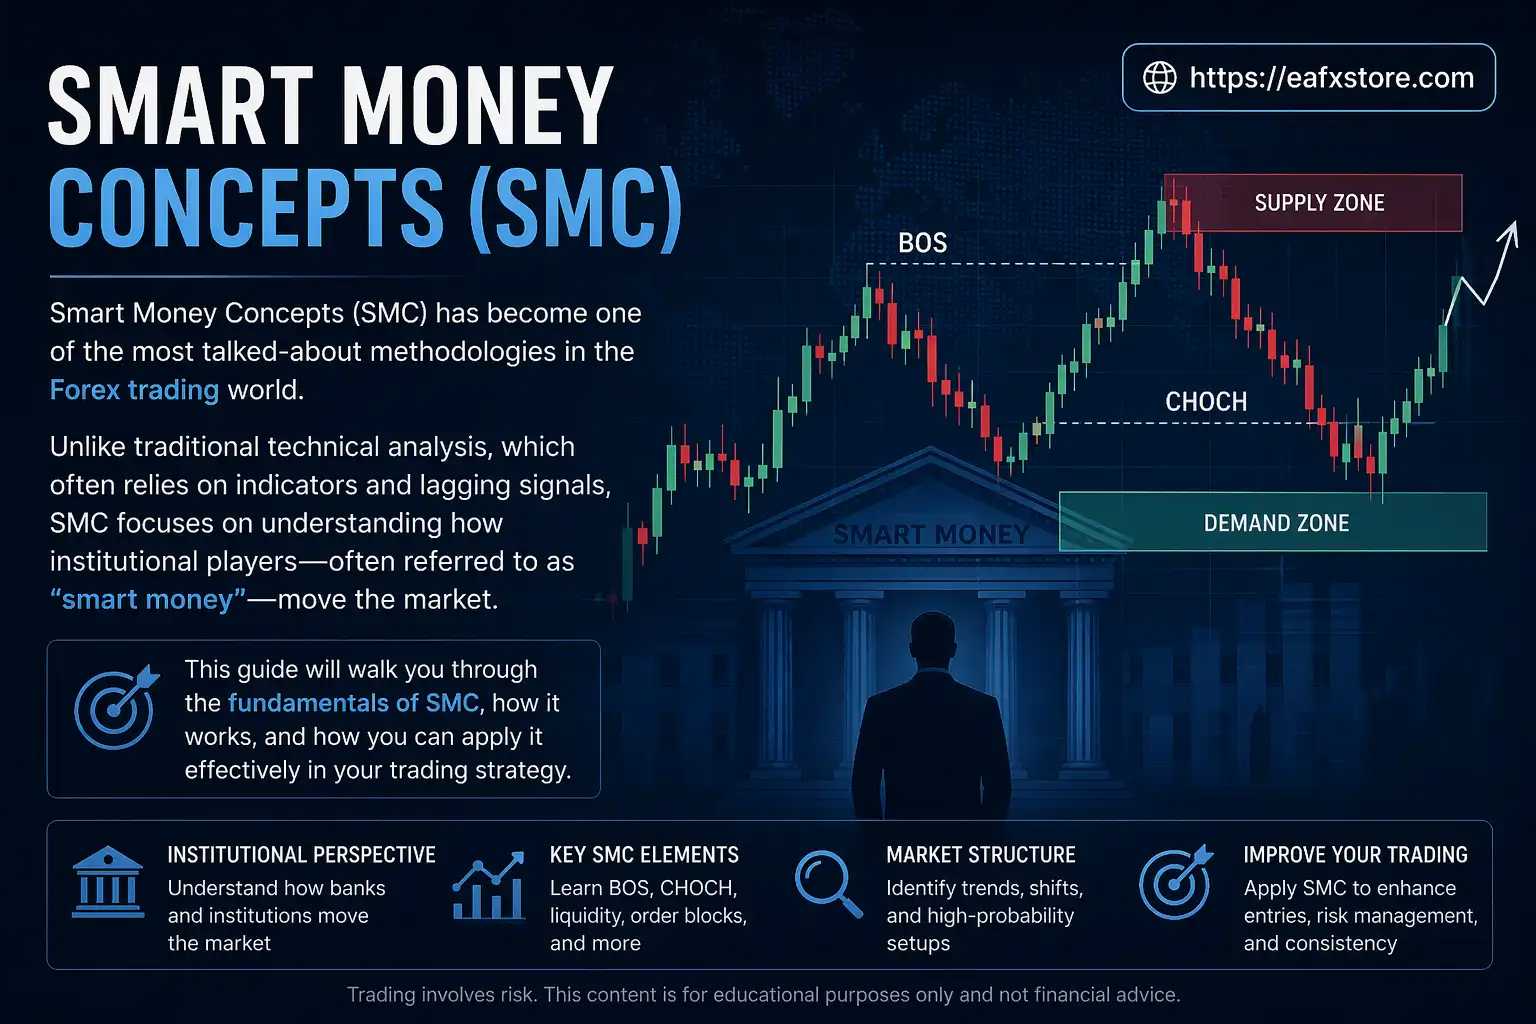
These zones represent institutional activity—large orders placed by banks and financial institutions that move the market.

➡️ Key Idea: Price tends to return to these zones because unfilled orders may still exist, creating opportunities for traders to enter high-probability trades.
How Supply and Demand Zones Form
Supply and demand zones are created when there is a sudden and strong movement in price, often leaving behind a base or consolidation area.
Typical Formation Pattern:
- Base – A period of consolidation (small candles, sideways movement)
- Rally or Drop – A strong move away from the base
- Rally-Base-Rally (RBR) → Demand zone
- Drop-Base-Drop (DBD) → Supply zone
- Rally-Base-Drop (RBD) → Supply zone (reversal)
- Drop-Base-Rally (DBR) → Demand zone (reversal)
These patterns indicate where institutions likely entered large positions.

Why Supply and Demand Zones Work
The effectiveness of supply and demand zones lies in market psychology and order flow.
- Large institutions cannot execute all orders at once.
- They leave behind unfilled orders in key areas.
- When price returns, those orders get filled.
- This creates strong reactions (reversals or continuations).
Advantages Over Traditional Indicators:
| Feature | Supply & Demand | Indicators |
|---|---|---|
| Lagging vs Leading | Leading | Lagging |
| Based on Price Action | Yes | No |
| Institutional Insight | Yes | No |
| Entry Precision | High | Medium |
How to Identify Strong Zones
Not all zones are equal. The strength of a zone determines its reliability.
Key Characteristics of Strong Zones:
- Strong departure: Price leaves the zone with large candles and momentum.
- Fresh zone: Price has not returned to the zone yet.
- Clean structure: Minimal price overlap or noise.
- Time spent in base: Short consolidation is better.
- Higher timeframe alignment: Zones on H4, Daily or Weekly are more reliable.
Weak Zones to Avoid:
- Multiple retests.
- Slow or weak price movement away.
- Messy or choppy structure.

How to Trade Supply & Demand Zones
There are two main approaches to trading these zones:
Aggressive Entry
- Enter immediately when price touches the zone.
- No confirmation needed.
- Higher risk, higher reward.
Conservative Entry
- Wait for confirmation (e.g., candlestick patterns, structure break).
- Lower risk, slightly reduced reward.
Step-by-Step Trading Strategy
Step 1: Identify the Trend
Use higher timeframes to determine overall market direction.
- Uptrend → Focus on demand zones.
- Downtrend → Focus on supply zones.
Step 2: Mark Zones
Draw zones around the base before the strong move.

Step 3: Wait for Price to Return
Patience is key—do not chase price.
Step 4: Look for Confirmation (Optional)
Examples include:
- Pin bars.
- Engulfing candles.
- Break of structure.
Step 5: Set Entry, Stop Loss and Take Profit
| Element | Placement |
|---|---|
| Entry | Inside the zone |
| Stop Loss | Just beyond the zone |
| Take Profit | Next opposing zone |
Tips to Improve Your Results
- Combine zones with price action signals.
- Use multiple timeframes for confirmation.
- Backtest your strategy on historical data.
- Keep a trading journal to track performance.
Supply and Demand vs Support and Resistance
Many traders confuse these concepts, but they are not the same.
| Aspect | Supply & Demand | Support & Resistance |
|---|---|---|
| Based on | Order flow | Price levels |
| Precision | Zones (areas) | Lines |
| Effectiveness | Higher (if used correctly) | Moderate |
| Institutional relevance | High | Low |
Supply and demand zones provide deeper insight into why price moves, not just where it reacts.
Conclusion
Supply and demand zones offer a powerful framework for understanding market movements and improving Forex entries. By focusing on areas where institutions are likely to act, traders can position themselves ahead of the crowd.
However, success with this strategy requires practice, patience and discipline. Not every zone will work, but with proper risk management and consistent execution, supply and demand trading can significantly enhance your edge in the Forex market.
If you’re serious about improving your entries, start marking zones today and observe how price behaves around them. Over time, you’ll develop the intuition needed to trade them effectively.