Volume plays a crucial role in understanding market strength and price movement in Forex trading. While the Forex market is decentralized and lacks a centralized volume measure like stocks, traders can still rely on tick volume and specialized indicators to gauge activity. In this guide, we’ll explore the best volume indicators for Forex trading and how to use them effectively.
What is Volume in Forex Trading?
Volume in Forex refers to the number of price changes (tick volume) rather than actual traded contracts. Since Forex operates over-the-counter (OTC), traders rely on broker-provided data to estimate market participation.
Understanding volume helps traders confirm trends, identify reversals and avoid false signals. High volume often indicates strong market interest, while low volume suggests weak momentum.
Why Volume Indicators Matter in Forex
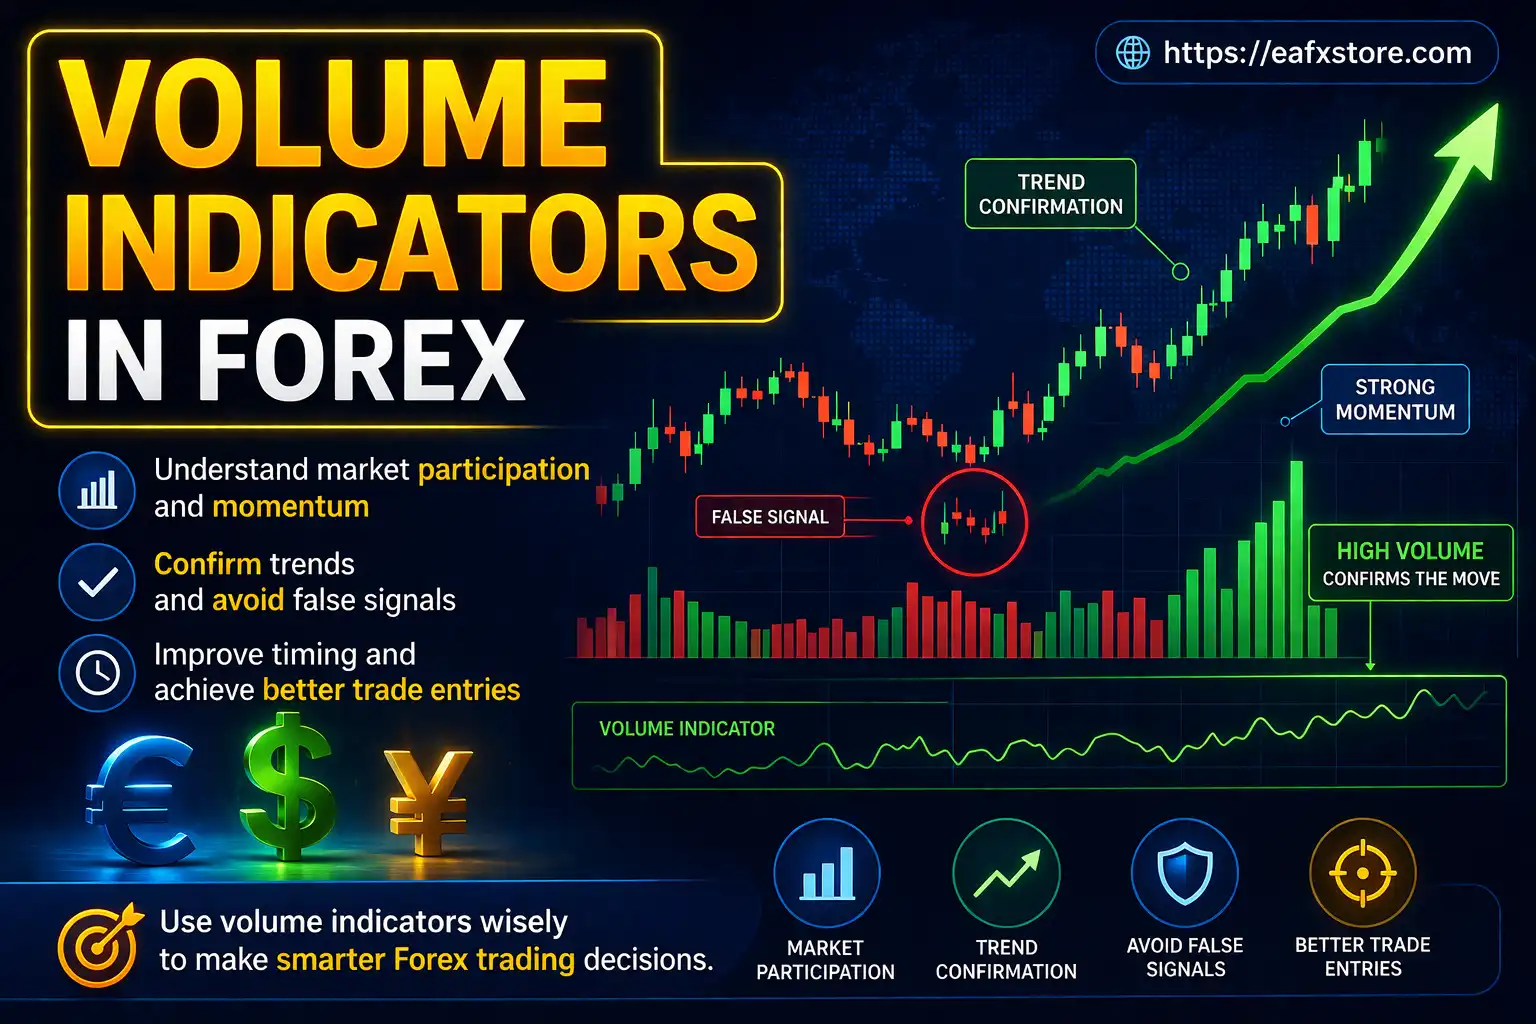
Volume indicators add an extra layer of confirmation to price action. Many traders rely solely on price charts, but volume helps answer a critical question: How strong is the move?
When price moves with strong volume, it signals conviction. Conversely, price movements with low volume may indicate potential reversals or weak trends. This makes volume indicators essential tools for improving trade accuracy and reducing risk.
On-Balance Volume (OBV)
On-Balance Volume (OBV) is one of the most widely used volume indicators. It tracks cumulative buying and selling pressure by adding volume on up days and subtracting it on down days.
OBV helps traders confirm trends. If price is rising and OBV is also rising, the trend is considered strong. However, divergence between OBV and price may signal a potential reversal.
This indicator is especially useful for spotting hidden momentum that may not be visible in price action alone.

Volume Oscillator
The Volume Oscillator measures the difference between two moving averages of volume. It helps traders identify whether volume is increasing or decreasing over time.
A rising oscillator indicates growing market participation, while a falling one suggests declining interest. This can be particularly useful during breakouts—strong volume increases often confirm valid breakouts, while weak volume may signal false moves.
Traders often combine the Volume Oscillator with support and resistance levels for better decision-making.

Accumulation/Distribution Line (A/D Line)
The Accumulation/Distribution Line evaluates whether a currency pair is being accumulated (bought) or distributed (sold). It considers both price and volume to provide a more complete picture of market behavior.
If the A/D line is rising, it suggests buying pressure. If it is falling, selling pressure dominates. Divergence between price and the A/D line can indicate potential trend reversals.
This indicator is particularly helpful in ranging markets where price alone may be misleading.

Money Flow Index (MFI)
The Money Flow Index (MFI) is often referred to as a volume-weighted version of the RSI. It combines price and volume to identify overbought and oversold conditions.
MFI values range from 0 to 100. Readings above 80 indicate overbought conditions, while readings below 20 suggest oversold conditions.
What makes MFI powerful is its ability to detect divergence. If price is rising but MFI is falling, it may signal weakening momentum and a possible reversal.

VWAP (Volume Weighted Average Price)
VWAP stands for Volume Weighted Average Price. It calculates the average price of a currency pair based on volume and price over a specific period.
VWAP is widely used by institutional traders to determine fair value. When the price is above the VWAP, the market is considered bullish. When it is below, the market is bearish.
In Forex trading, VWAP is particularly useful for intraday strategies. It helps traders identify entry points and avoid overpaying during strong trends.

Tick Volume Indicator
Since Forex lacks centralized volume data, tick volume becomes a reliable alternative. It measures how many times price changes within a given period.
Tick volume is surprisingly effective and often correlates strongly with actual market volume. High tick volume indicates strong activity, while low tick volume suggests consolidation.
Many professional traders use tick volume alongside price action to confirm breakouts and trend strength.

Comparison of Top Volume Indicators
| Indicator | Best For | Key Advantage | Limitation |
|---|---|---|---|
| OBV | Trend confirmation | Simple and effective | Lagging in volatile markets |
| Volume Oscillator | Volume momentum | Detects strength changes | Requires parameter tuning |
| A/D Line | Market accumulation/distribution | Combines price and volume | Can give false signals in ranges |
| MFI | Overbought/oversold signals | Volume-weighted RSI | Sensitive to short-term noise |
| VWAP | Intraday trading | Institutional benchmark | Less useful for long-term trades |
| Tick Volume | General activity measurement | Widely available in Forex | Not actual traded volume |
How to Use Volume Indicators Effectively
Using volume indicators effectively requires combining them with other tools such as support/resistance, trendlines and price action.
For example, if a breakout occurs with high volume, it is more likely to be valid. On the other hand, a breakout with low volume may fail. Similarly, divergence between volume indicators and price often signals a potential reversal.
It’s also important not to rely on a single indicator. Combining two or three complementary tools can significantly improve trading accuracy.
Common Mistakes When Using Volume Indicators
One common mistake is treating volume as a standalone signal. Volume should always confirm price action, not replace it.
Another mistake is ignoring market context. Volume behaves differently during news events, low-liquidity sessions, or ranging markets. Traders must adapt their interpretation accordingly.
Lastly, overloading charts with too many indicators can lead to confusion. Keeping your setup simple and focused is often more effective.
Conclusion
Volume indicators are powerful tools that can enhance your Forex trading strategy by providing insights into market strength and participation. While Forex does not offer centralized volume data, tick volume and advanced indicators still provide valuable information.
From OBV and MFI to VWAP and the A/D Line, each indicator serves a unique purpose. The key is to understand how they work and combine them effectively with price action.
By mastering volume analysis, traders can make more informed decisions, avoid false signals and improve overall trading performance.