
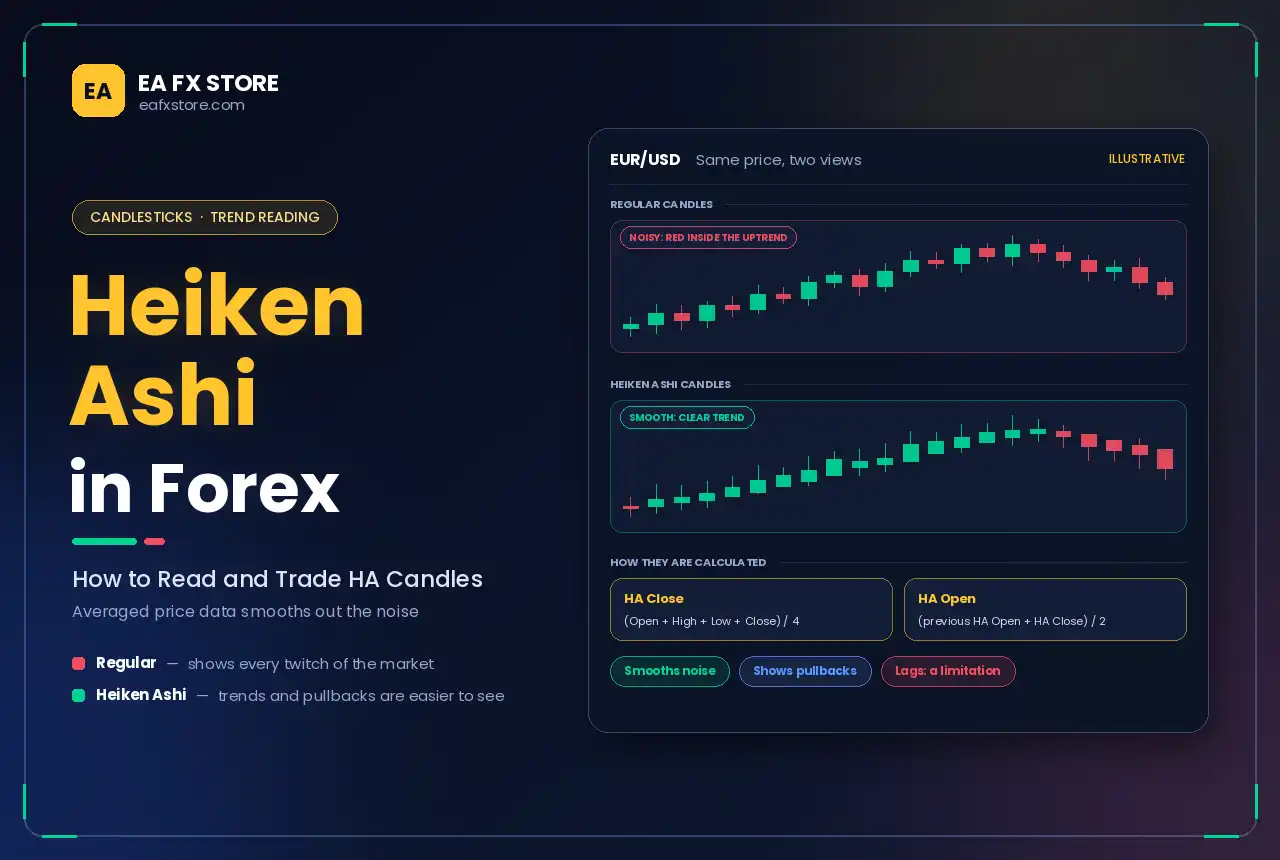
Regular candlestick charts show every twitch of the market. That detail is useful, but it can also make trends hard to follow, with red candles appearing in the middle of strong uptrends and green candles in the middle of downtrends. Heiken Ashi candles take a different approach. By averaging price data, they smooth out the noise and make trends, pullbacks and potential reversals much easier to see.
This guide explains what Heiken Ashi is, how the candles are calculated, how to read them, how to build a simple trading strategy and what limitations you must keep in mind.
What is Heiken Ashi?
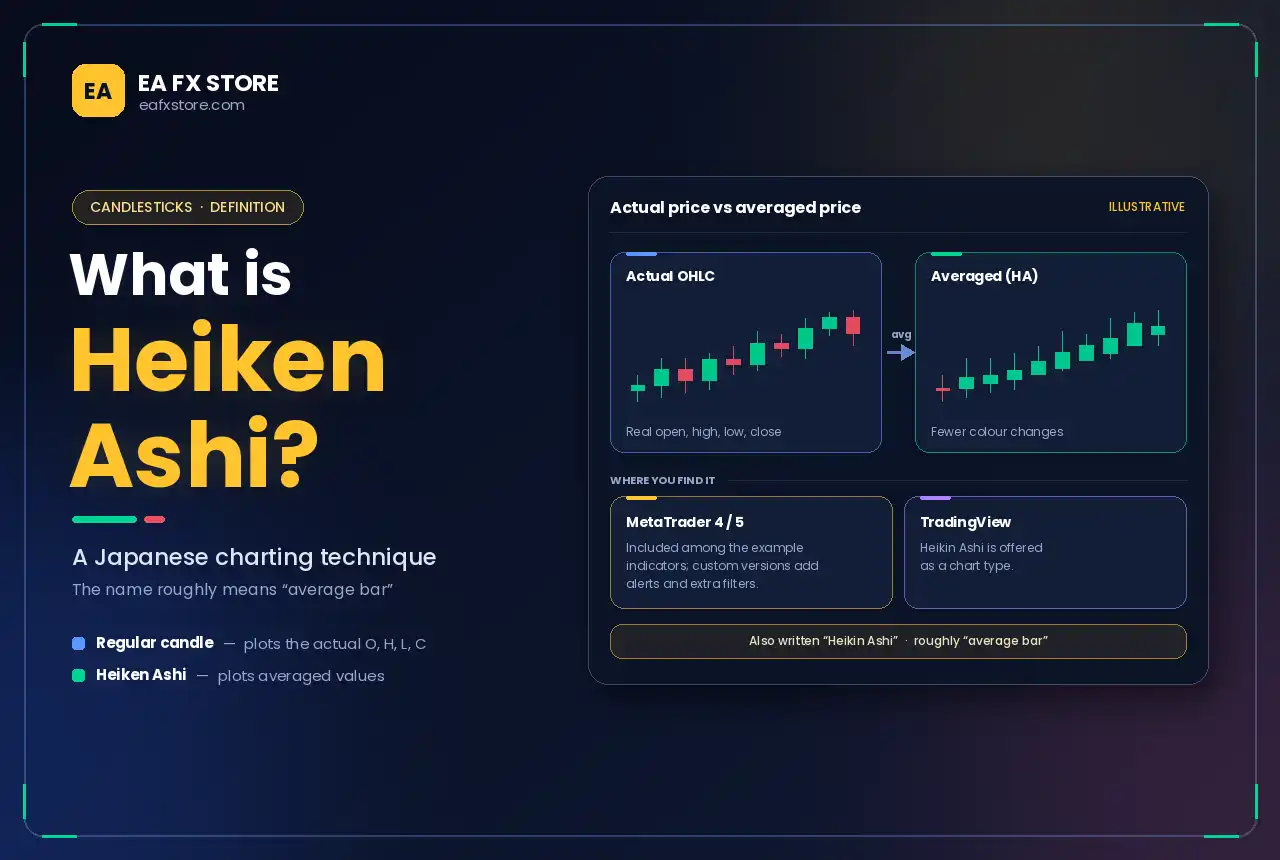
Heiken Ashi, also written Heikin Ashi, is a Japanese charting technique whose name roughly means “average bar”. Instead of plotting the actual open, high, low and close of each period, it plots averaged values, creating candles that change colour less often and show the direction of the trend more clearly.
On MetaTrader 4 and MetaTrader 5, a Heiken Ashi indicator is included among the example indicators that come with the platform, and many custom versions with alerts and extra filters are available. TradingView offers Heikin Ashi as a chart type.
How Heiken Ashi Candles Are Calculated
Each Heiken Ashi candle uses four formulas:
- HA Close = (Open + High + Low + Close) ÷ 4
- HA Open = (previous HA Open + previous HA Close) ÷ 2
- HA High = the highest of the High, HA Open and HA Close
- HA Low = the lowest of the Low, HA Open and HA Close
The HA Close is the average price of the current period, while the HA Open is the midpoint of the previous Heiken Ashi candle. Because each candle depends on the one before it, Heiken Ashi behaves like a smoothed, slightly lagging view of price.
The open and close shown on a Heiken Ashi chart are not real market prices. The HA Close of a candle is an average, not the price at which the period actually closed. This matters for entries, stops and backtesting, as we explain below.
How to Read Heiken Ashi Candles
Heiken Ashi candles are read mainly by their colour, body size and wicks:
| Candle appearance | What it suggests |
| Green candles with no lower wick | Strong uptrend |
| Red candles with no upper wick | Strong downtrend |
| Green candles with small lower wicks | Uptrend continuing, some selling pressure |
| Small bodies with long wicks on both sides | Indecision, possible pause or reversal |
| Colour change after a long run | Possible trend change, needs confirmation |
The most useful signals are:
- No opposite wick: in a strong bullish trend, Heiken Ashi candles often have no lower wick at all, showing that buyers are firmly in control.
- Shrinking bodies: as a trend loses momentum, bodies become smaller.
- Doji-like candles: small bodies with long wicks on both sides warn that the trend may be ending.
- Colour change: a switch from green to red, or red to green, after an indecision candle is the classic reversal clue.
A Simple Heiken Ashi Trading Strategy
Here is a straightforward trend-following approach. Reverse the rules for short trades.
- Define the trend on a higher timeframe. For example, use the four-hour chart to confirm that the market is making higher highs and higher lows.
- Switch to your entry timeframe, such as the one-hour chart, with Heiken Ashi applied.
- Wait for a pullback, shown by a few red Heiken Ashi candles in the uptrend.
- Look for an indecision candle, with a small body and wicks on both sides, near a support level.
- Enter long when the next Heiken Ashi candle closes green, ideally with no lower wick.
- Place the stop below the recent real swing low on the standard candlestick chart, not just below the Heiken Ashi low.
- Stay in the trade while candles remain green with small or no lower wicks.
- Exit or tighten the stop when indecision candles appear or the colour turns red.
This approach lets you ride trends longer, because Heiken Ashi filters out many of the small counter-trend candles that tempt traders to exit early.
Combining Heiken Ashi With Other Tools
Heiken Ashi works best as a trend and momentum filter alongside other analysis:
- Moving averages: take long signals only when price is above a key moving average, such as the 50 or 200 period.
- Key levels: a Heiken Ashi reversal at a strong level, such as the Point of Control or a major support zone, carries more weight.
- Smart money concepts: use Heiken Ashi to confirm momentum after a liquidity sweep or a reaction from an order block. Our guide to Smart Money Concepts explains these ideas in depth.
- Volume: shrinking Heiken Ashi bodies on falling volume can confirm a weakening trend, an idea closely related to Volume Spread Analysis.
- Momentum indicators: RSI or MACD divergence can add evidence when Heiken Ashi candles start to shrink.
Heiken Ashi and Expert Advisors
Many EAs use Heiken Ashi as a trend filter or signal source. If you build or run one, keep these points in mind:
- Use real prices for orders. Entries, stop-losses and take-profits must be based on actual market prices, not Heiken Ashi values.
- Use closed candles only. The current Heiken Ashi candle keeps changing until the bar closes, so signals should come from completed bars.
- Be careful with backtests on HA charts. Testing on a chart built from Heiken Ashi prices can produce unrealistic results, because the fills do not match real prices.
- Check how the indicator is calculated. Some custom versions add extra smoothing, which increases lag.
- Combine with risk management. A smoother chart does not reduce market risk. Review our risk management tips before trading live.
Advantages of Heiken Ashi
- Clearer trends with less noise.
- Easier to stay in winning trades, because short pullbacks appear less dramatic.
- Simple visual signals that suit beginners and busy traders.
- Works on all timeframes and instruments.
Limitations of Heiken Ashi
- Lag: averaging makes signals appear later than on standard candles, so part of a move is often missed.
- Not real prices: HA open and close values differ from actual market prices, which can mislead entries and stops.
- Gaps are hidden: Heiken Ashi smooths over gaps, such as the weekly open in Forex.
- Weak in ranges: in sideways markets, colours change often, producing false signals.
- Less detail for price action: classic candlestick patterns, such as pin bars, look different or disappear.
Many traders keep a standard candlestick chart open next to their Heiken Ashi chart, using Heiken Ashi for trend direction and the standard chart for precise levels, price action signals and execution.
Frequently Asked Questions
What is Heiken Ashi in Forex?
It is a charting method that uses averaged price data to create smoother candles, making trends and potential reversals easier to identify.
Is it Heiken Ashi or Heikin Ashi?
Both spellings refer to the same technique. “Heikin Ashi” is closer to the Japanese term, while “Heiken Ashi” is common on MetaTrader.
Does Heiken Ashi repaint?
The current candle changes until it closes, like any candle. Once a bar closes, its Heiken Ashi values are fixed, although they depend on previous candles.
What is the best timeframe for Heiken Ashi?
It works on any timeframe, but many traders find it most useful on one-hour, four-hour and daily charts, where trends are clearer.
Conclusion
Heiken Ashi turns noisy price action into a smoother picture of the trend, helping you stay with strong moves and spot when momentum is fading. Remember that its prices are averages, not real quotes, and that its signals come with some lag. Use Heiken Ashi to define direction, confirm entries with real price levels and key zones, and always manage your risk carefully.
Risk warning: Trading Forex and CFDs on margin carries a high level of risk and may not be suitable for all investors. This article is for educational purposes only and is not investment advice.