Introduction
Timing is everything in Forex trading. Enter too early, and you risk unnecessary drawdowns. Enter too late, and you miss profitable opportunities. One of the most powerful tools traders use to improve timing is Fibonacci Retracement. This technical analysis tool helps identify potential reversal levels and optimal entry points based on mathematical ratios found in nature and financial markets.
In this guide, you’ll learn what Fibonacci Retracement is, how it works, and how to apply it effectively in Forex trading to enhance your trade timing.
What is Fibonacci Retracement?
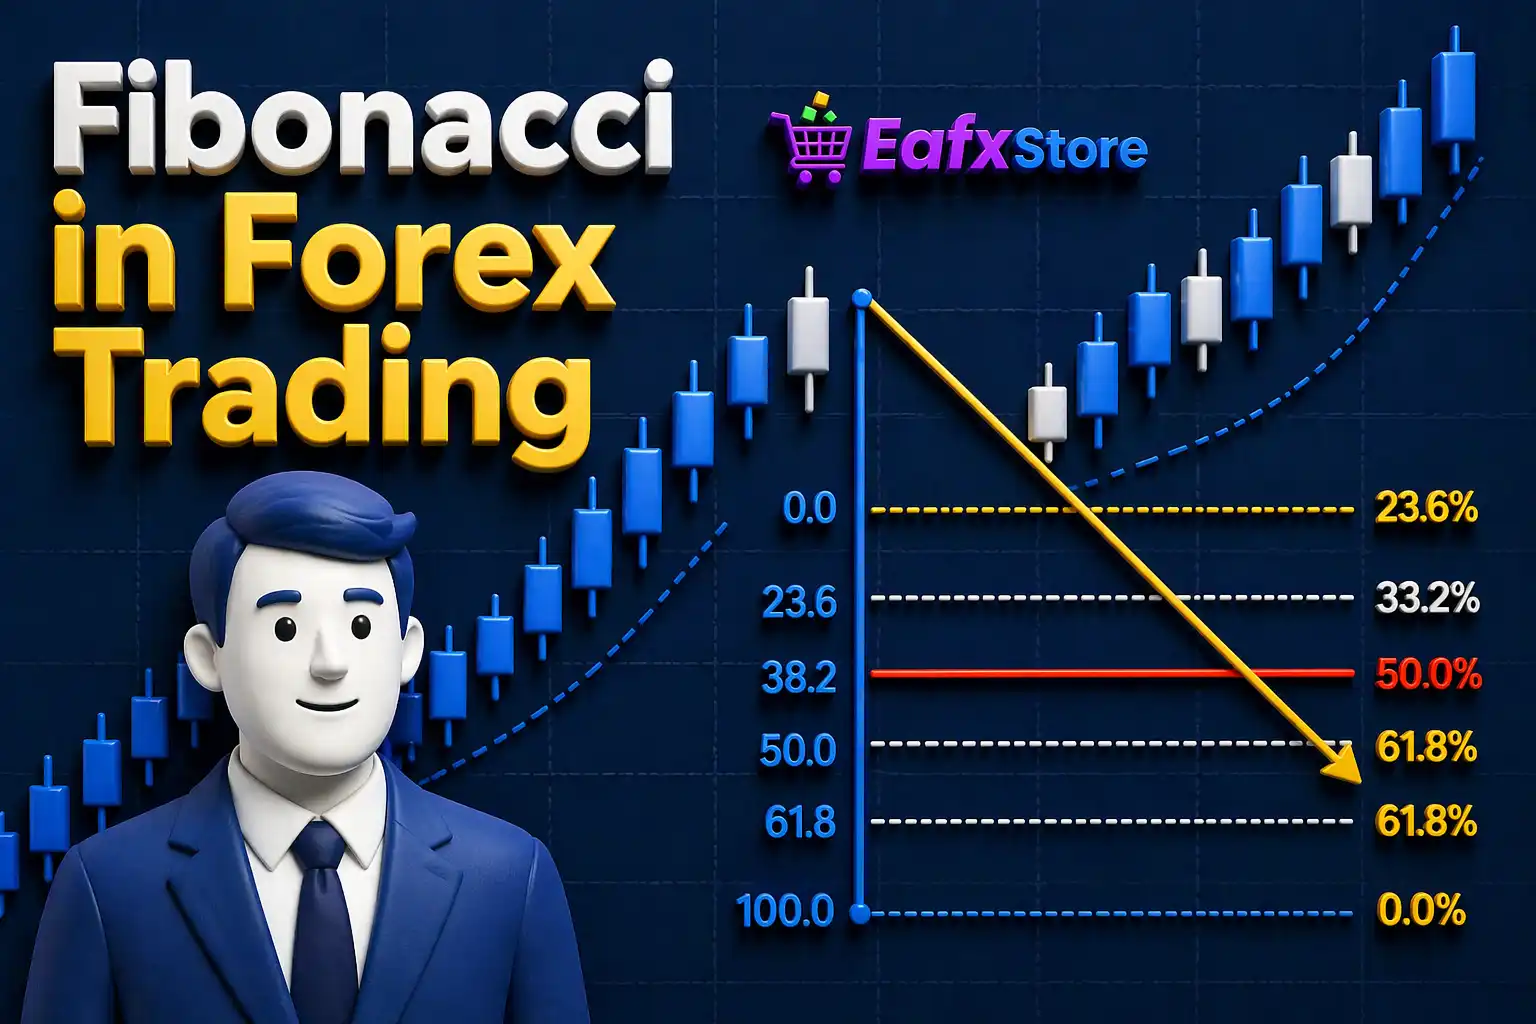
Fibonacci Retracement is a technical analysis tool that uses horizontal lines to indicate potential support and resistance levels. These levels are based on key Fibonacci ratios derived from the Fibonacci sequence.
The most commonly used Fibonacci retracement levels are:
- 23.6%
- 38.2%
- 50%
- 61.8%
- 78.6%
These levels represent areas where price is likely to retrace before continuing in the original trend.
Why Fibonacci Retracement Works in Forex
Forex markets are heavily influenced by trader psychology. Since many traders use Fibonacci levels, these levels often become self-fulfilling support and resistance zones.
Here’s why it works:
- Market participants react to key levels
- Algorithms incorporate Fibonacci ratios
- Trends often move in waves (impulse + correction)
By identifying retracement zones, traders can align themselves with the dominant trend while minimizing risk.

How to Draw Fibonacci Retracement Correctly
To use Fibonacci Retracement effectively, you must first identify a clear trend.
1. In an Uptrend:
- Identify the lowest point (swing low)
- Identify the highest point (swing high)
- Draw the Fibonacci tool from low to high
2. In a Downtrend:
- Identify the highest point (swing high)
- Identify the lowest point (swing low)
- Draw the Fibonacci tool from high to low
Once drawn, the retracement levels will automatically appear on your chart.

Key Fibonacci Levels Explained
1. 23.6% – Shallow Retracement
This level indicates strong momentum. Price often barely pulls back before continuing.
2. 38.2% – Moderate Retracement
A common level where price pauses before resuming the trend.
3. 50% – Psychological Level
Not officially a Fibonacci ratio, but widely used. Indicates a balanced correction.
4. 61.8% – Golden Ratio
The most important level. Often acts as a strong reversal zone.
5. 78.6% – Deep Retracement
Indicates a weaker trend but still valid for potential reversals.

How to Use Fibonacci Retracement for Better Trade Timing
1. Trade with the Trend
Fibonacci works best in trending markets.
- In an uptrend → look for buy opportunities
- In a downtrend → look for sell opportunities
Avoid using it in sideways markets where signals become unreliable.
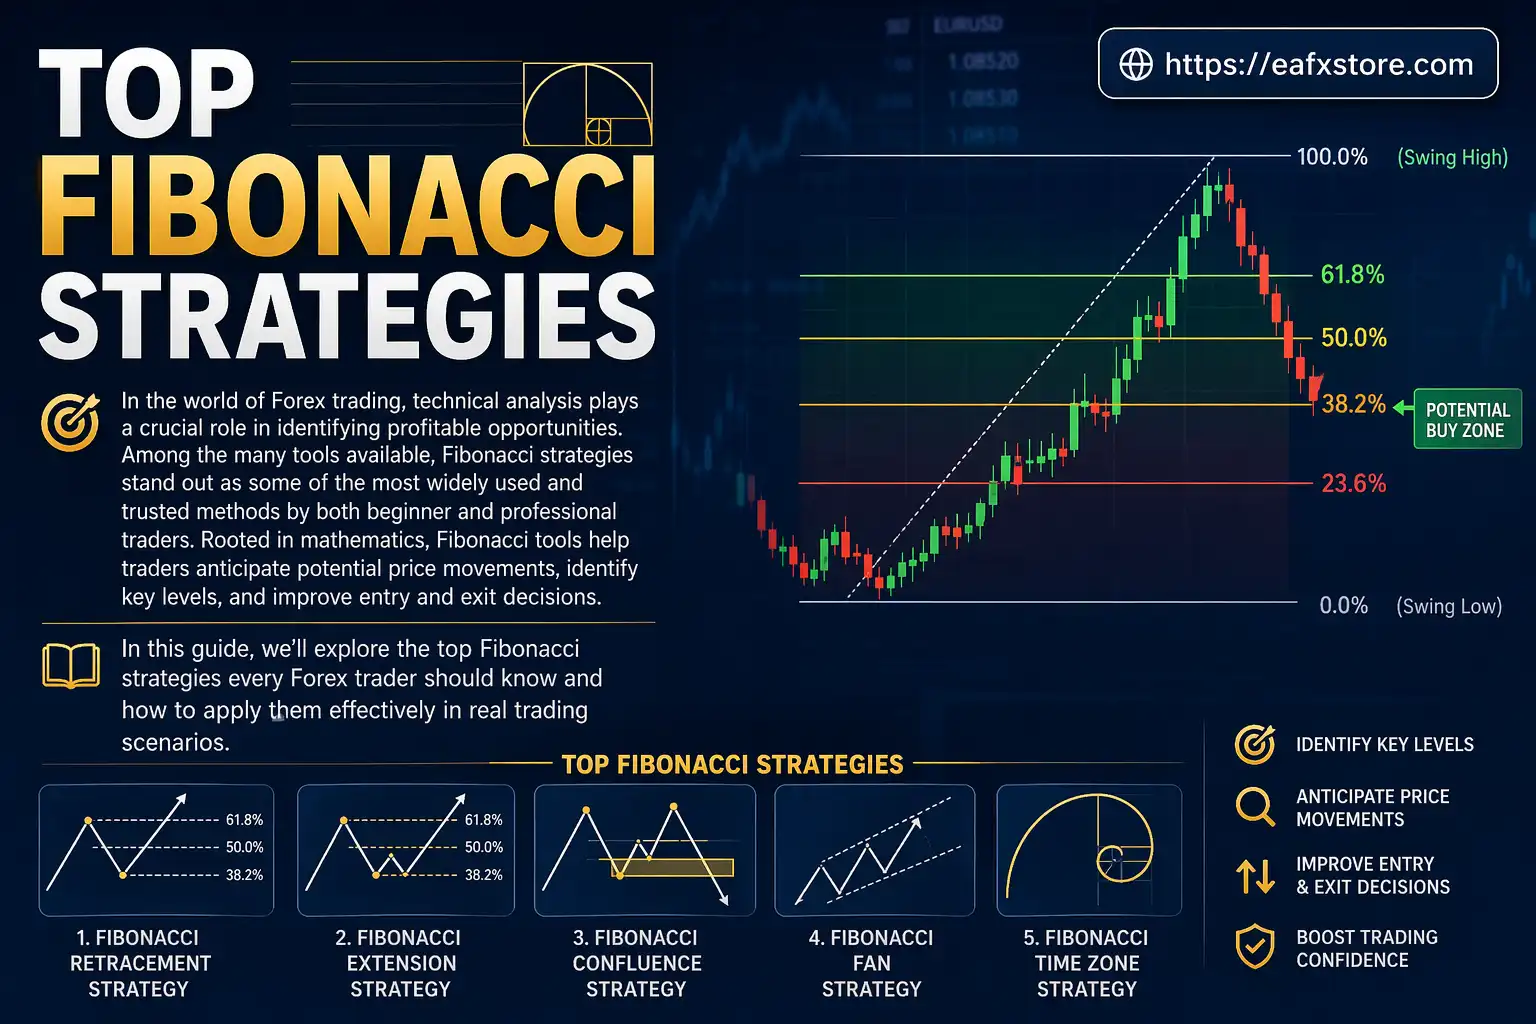
2. Combine with Support and Resistance
The best trades occur when Fibonacci levels align with:
- Previous support/resistance
- Trendlines
- Key price zones
This creates confluence, increasing the probability of a successful trade.
3. Use Candlestick Confirmation
Never enter a trade based solely on Fibonacci levels.
Wait for confirmation such as:
- Pin bars
- Engulfing candles
- Doji patterns
These signals indicate that the market is reacting to the Fibonacci level.
4. Set Entry, Stop Loss, and Take Profit
A simple strategy:
- Entry: At Fibonacci level (e.g., 38.2% or 61.8%)
- Stop Loss: Below the next level or swing low/high
- Take Profit: Previous high/low or extension levels
Example:
- Uptrend retraces to 61.8%
- Bullish engulfing candle appears
- Enter buy
- Stop below 78.6%
- Target previous high
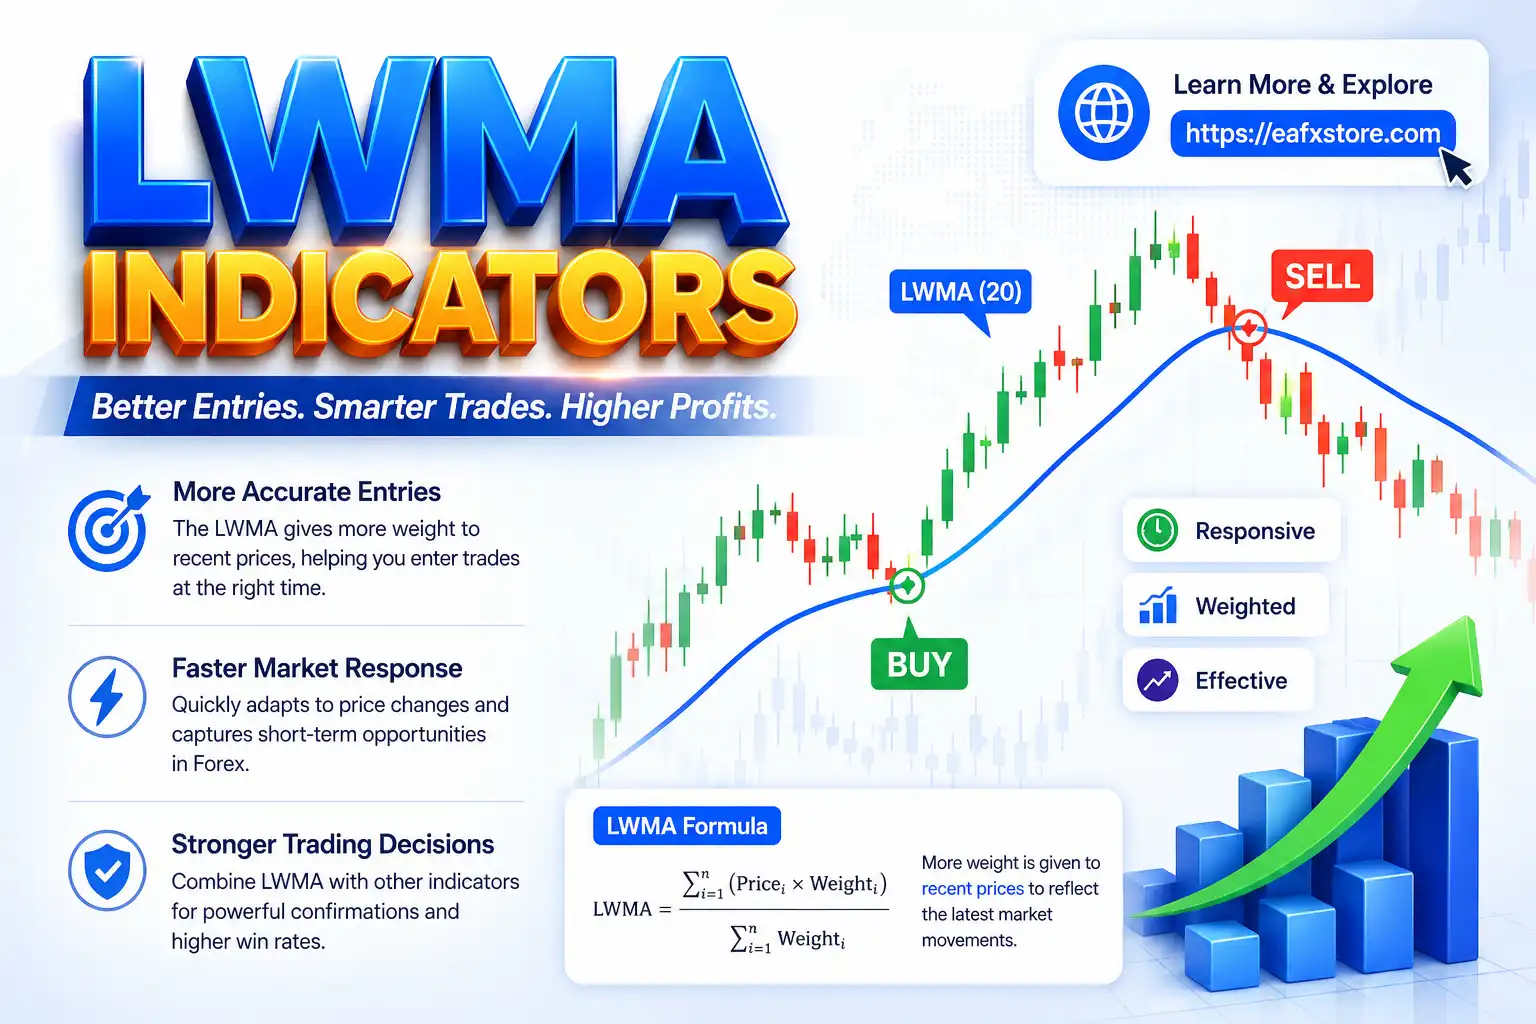
5. Combine with Other Indicators
To improve accuracy, combine Fibonacci with:
- Moving Averages
- RSI (Relative Strength Index)
- MACD
- Trendlines
The more confirmations you have, the stronger your setup.

Common Mistakes to Avoid
1. Drawing Fibonacci Incorrectly
Always use clear swing highs and lows. Poor placement leads to unreliable levels.
2. Using It in Ranging Markets
Fibonacci is less effective when the market lacks a clear trend.
3. Ignoring Market Structure
Always consider higher highs, higher lows (uptrend) or lower highs, lower lows (downtrend).
4. Overtrading Every Level
Not every Fibonacci level will hold. Focus on key levels like 38.2% and 61.8%.
Practical Example
Imagine EUR/USD is in an uptrend:
- Price moves from 1.1000 to 1.1200
- You draw Fibonacci from low to high
- Price retraces to 61.8%
- A bullish candle forms
This is a high-probability entry point because:
- Trend is upward
- Key Fibonacci level is respected
- Price action confirms reversal
Advanced Tips for Better Results
1. Use Multiple Timeframes
Check Fibonacci levels on higher timeframes (H4, Daily) for stronger signals.
2. Combine with Fibonacci Extensions
Use extensions (127%, 161.8%) to set profit targets.
3. Wait for Confluence Zones
The more factors aligning at a level, the better the trade.
Conclusion
Fibonacci Retracement is a powerful tool that can significantly improve your Forex trade timing when used correctly. It helps traders identify optimal entry points, manage risk and align with market trends.
However, it should never be used in isolation. The key to success lies in combining Fibonacci with price action, trend analysis and other technical indicators.
Mastering Fibonacci Retracement takes practice, but once you understand its logic and application, it becomes an essential part of a profitable Forex trading strategy.